Perceptual image quality assessment using a
Normalized Laplacian Pyramid
V. Laparra, J. Ballé, A. Berardino, and E. P. Simoncelli
Abstract
We present an image quality metric based on the transformations associated with the early visual system: local luminance subtraction and local contrast gain control. Images are first decomposed using a Laplacian pyramid, which subtracts a local estimate of the mean luminance at multiple scales. Each pyramid coefficient is then divided by a local estimate of amplitude (weighted sum of absolute values). The quality of the distorted image, relative to its undistorted original, is the root mean squared error in this "normalized Laplacian" domain. The weights are optimized to estimate local amplitude using (undistorted) images from a separated database. We show that both luminance and contrast stages lead to significant reductions in redundancy, relative to the original image pixels. We also show that the resulting quality metric provides a better account of human perceptual judgements than either MS-SSIM or a recently-published gain-control metric based on oriented filters.
Block diagram of the model.
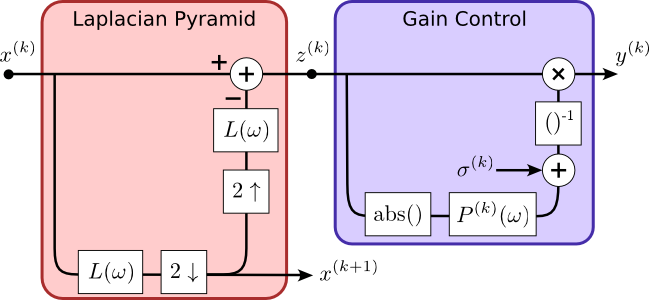
These are the basic operations performed by the model in each scale k, note that the scheme is recursive. x is the input, z is the intermediate step (after luminance subtraction), and y is the output (after contrast normalization). The operations L(ω) and P(ω) are convolutions using the Laplacian filter and the contrast normalization filter respectively.
Illustration of the stages in the model.
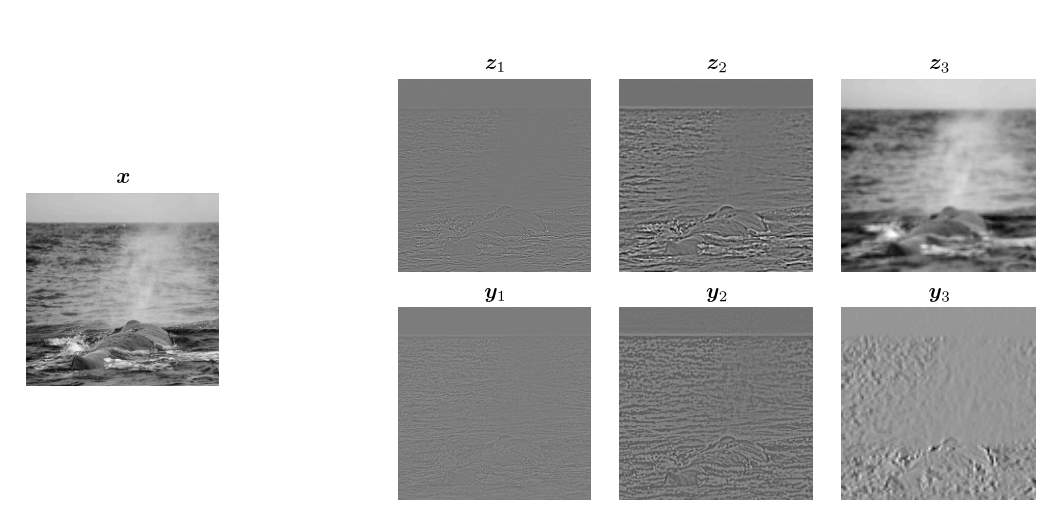
x is the original image. z is the decomposition of the image using the Laplacian pyramid (just three scales shown), each column correspond to a different scale. Note that the Laplacian Pyramid includes a downsampling in each scale, the examples shown here have been upsampled in order to improve the visualization. y is the image in the normalized Laplacian domain. Each column image corresponds to the normalized version of the Laplacian decomposition in the same column.
Image Quality Assessment Results (on TID 2008 database)
 |
 |
 |
 |
 |
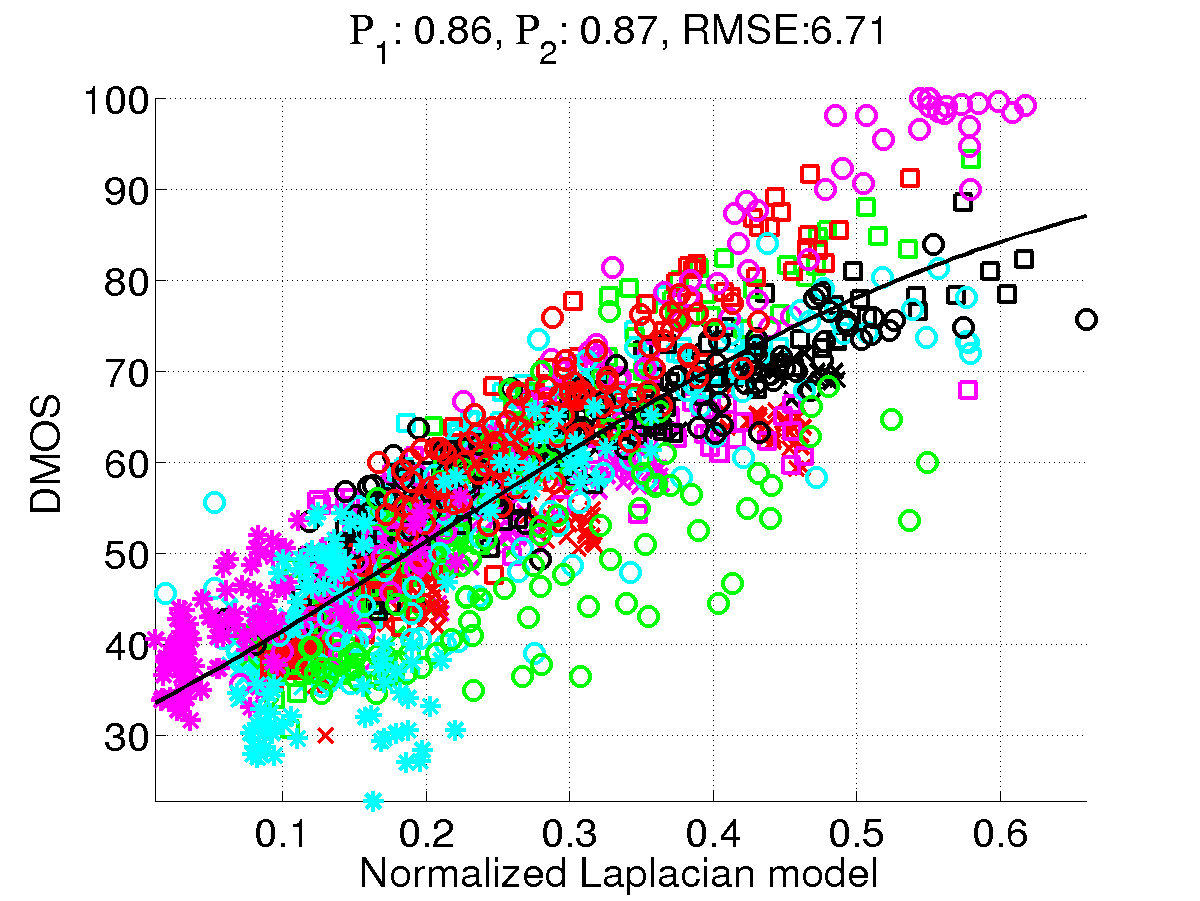 |
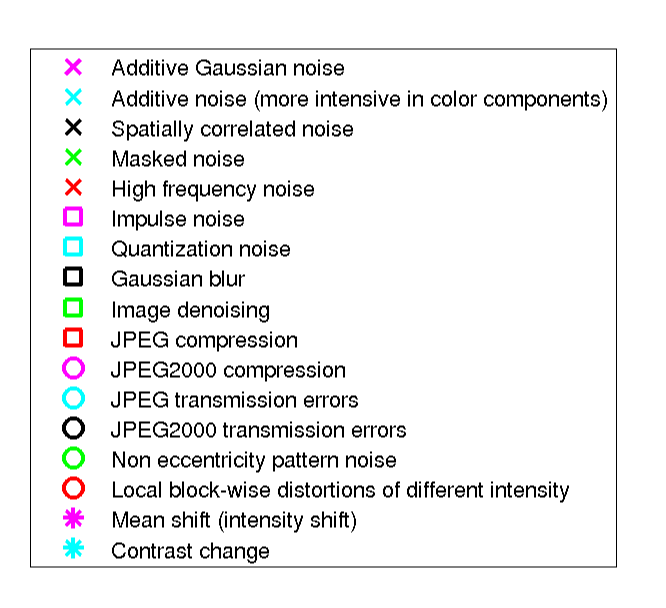
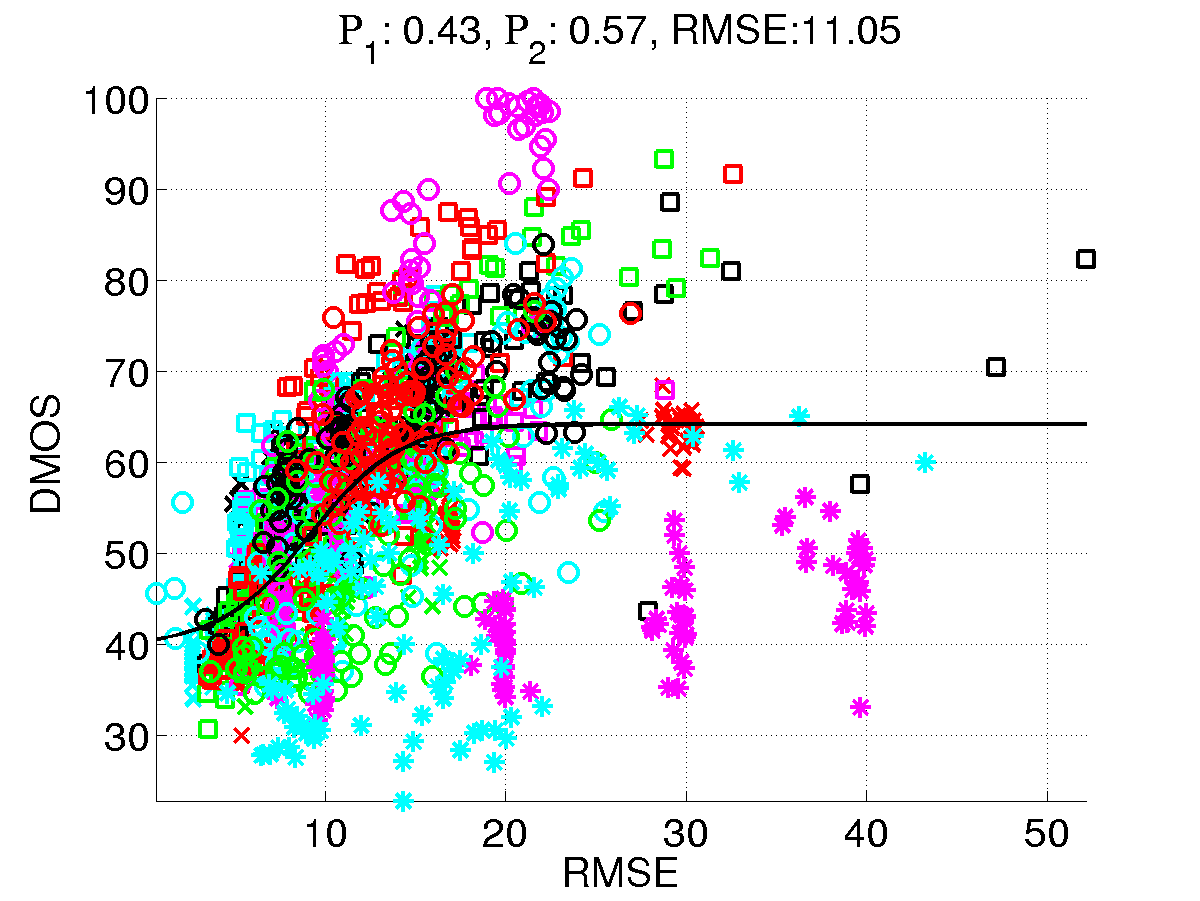
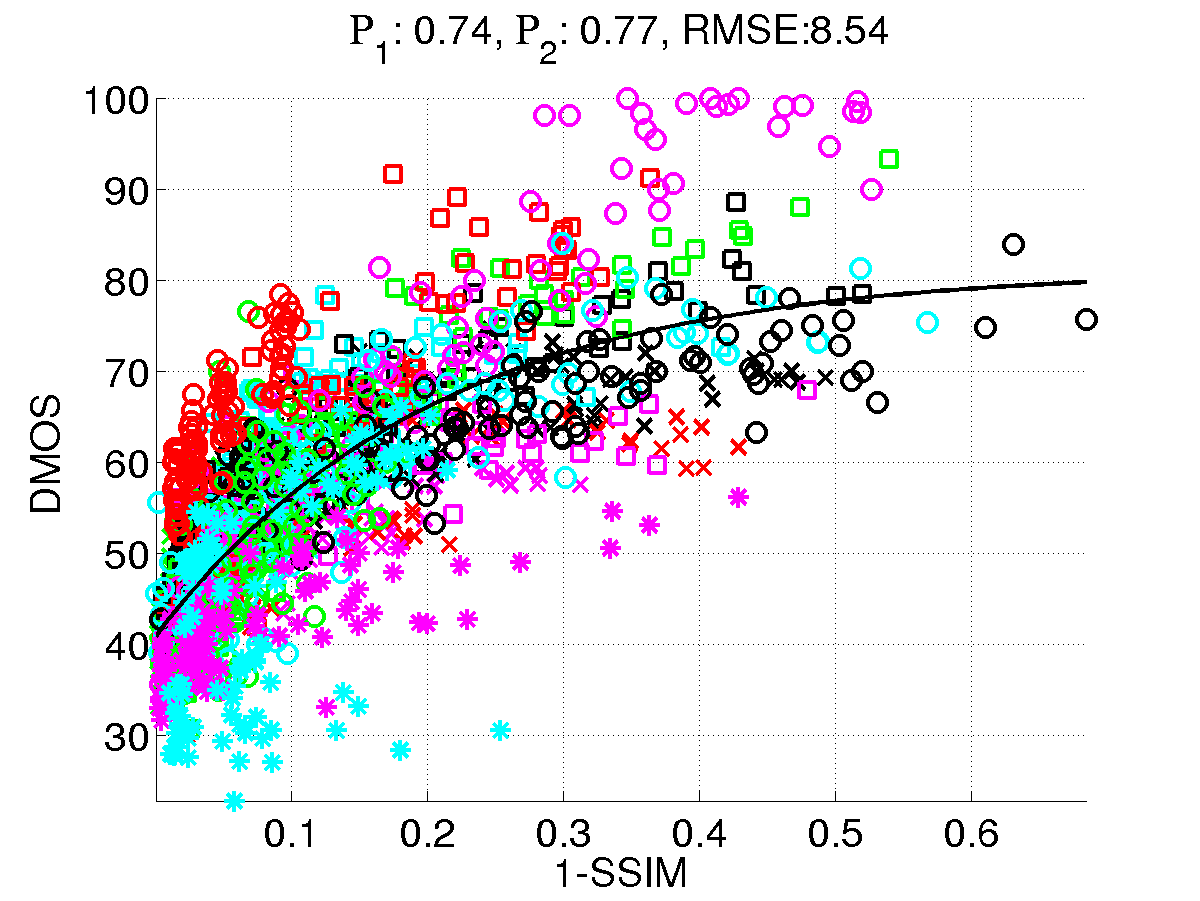
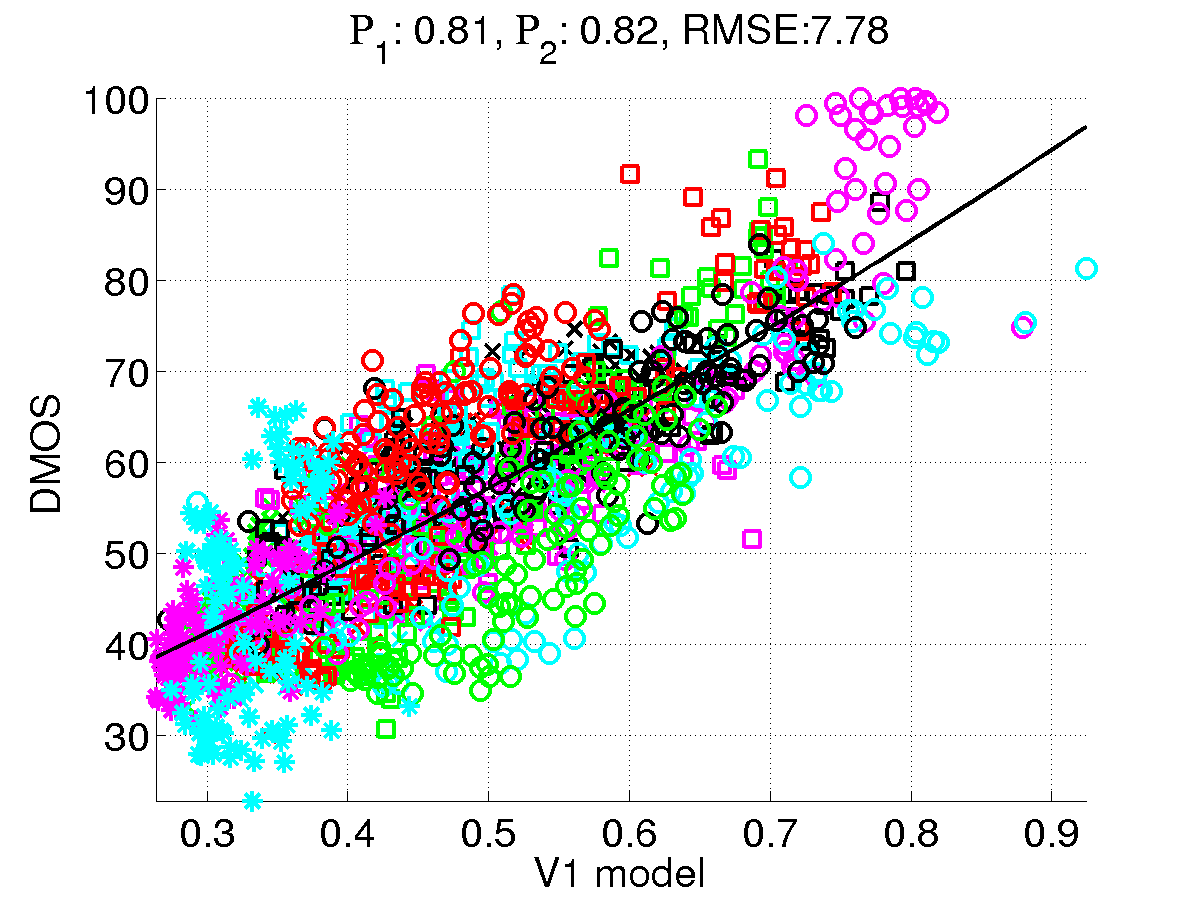
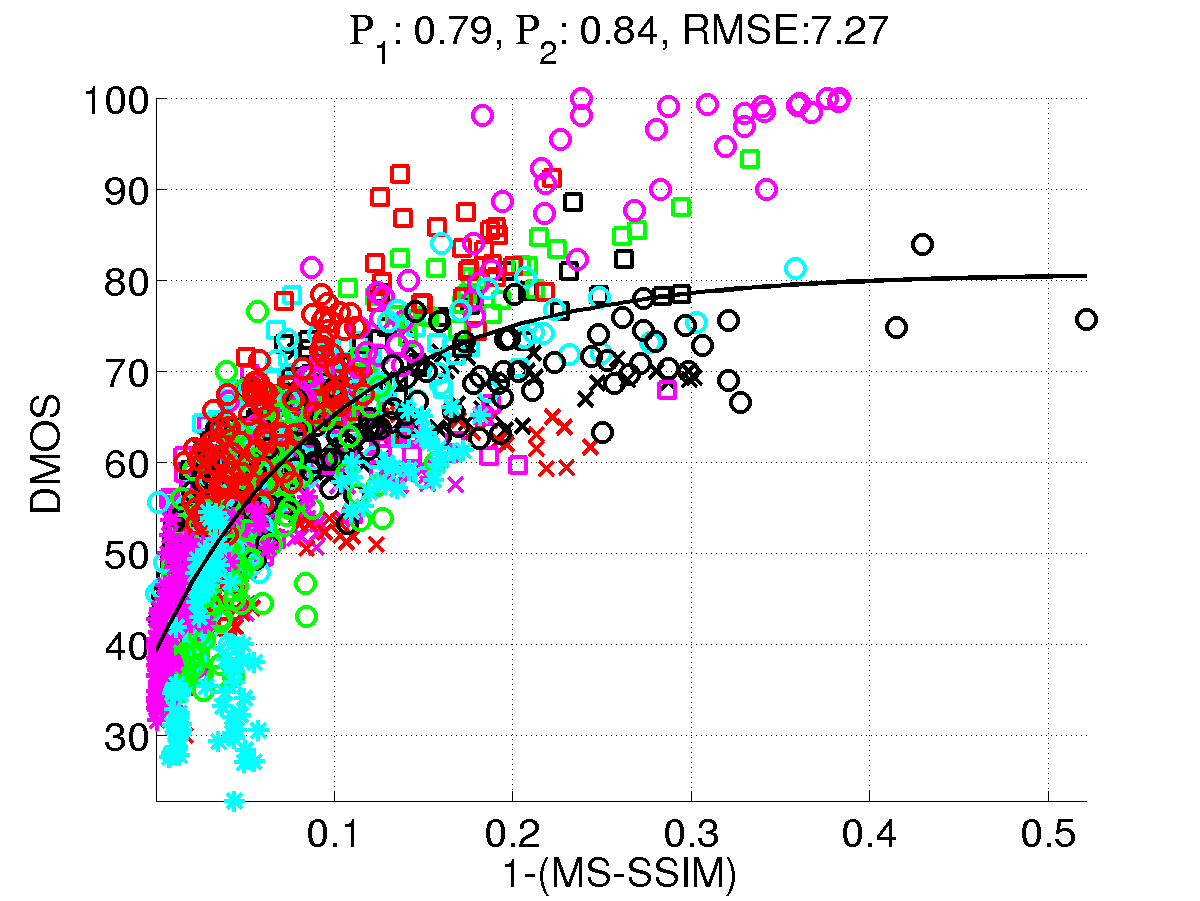
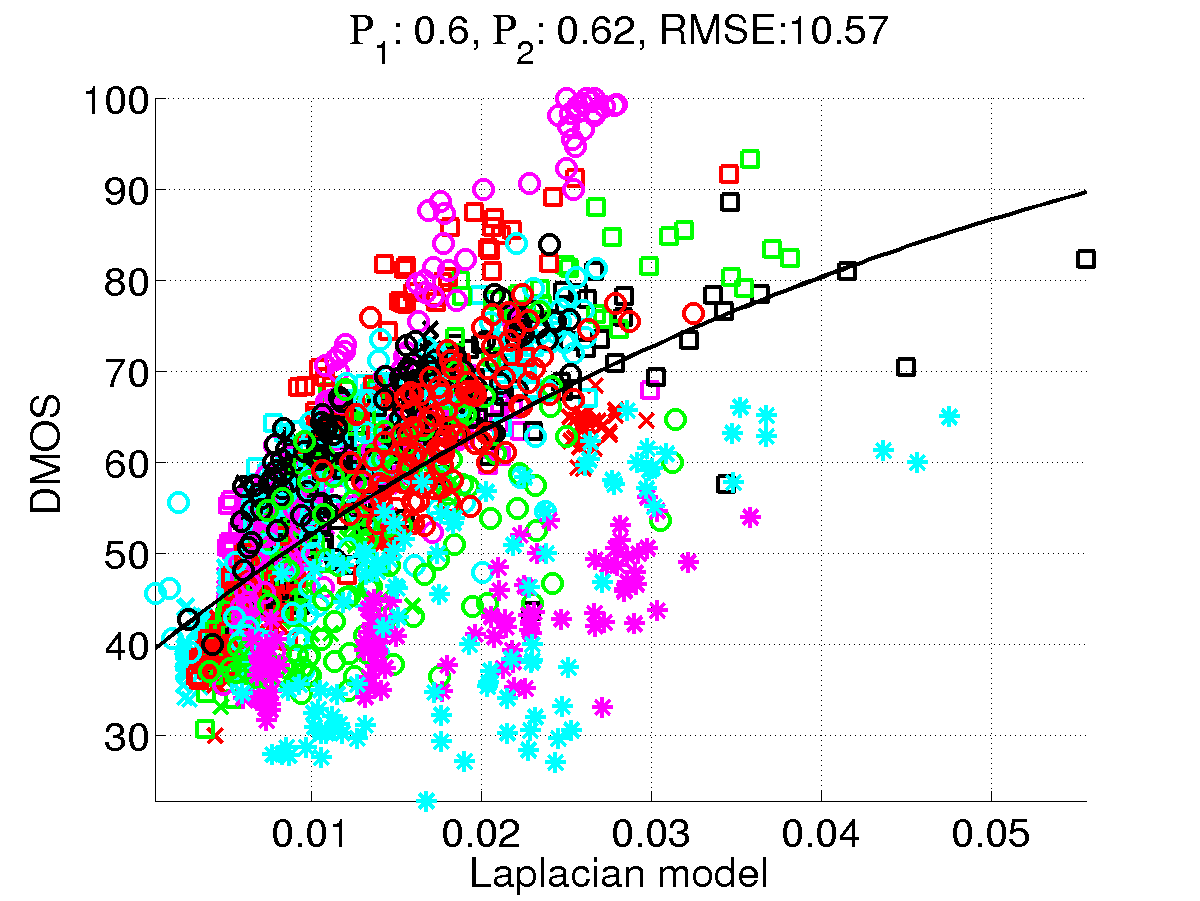
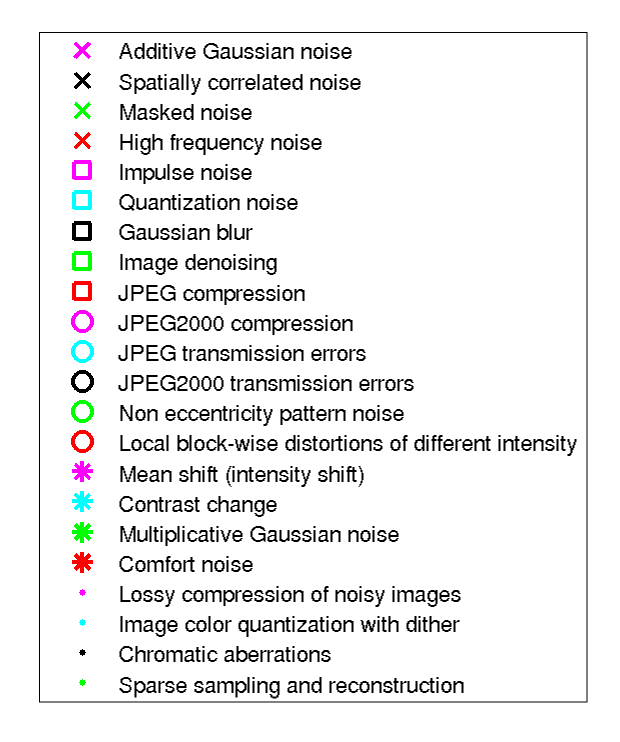
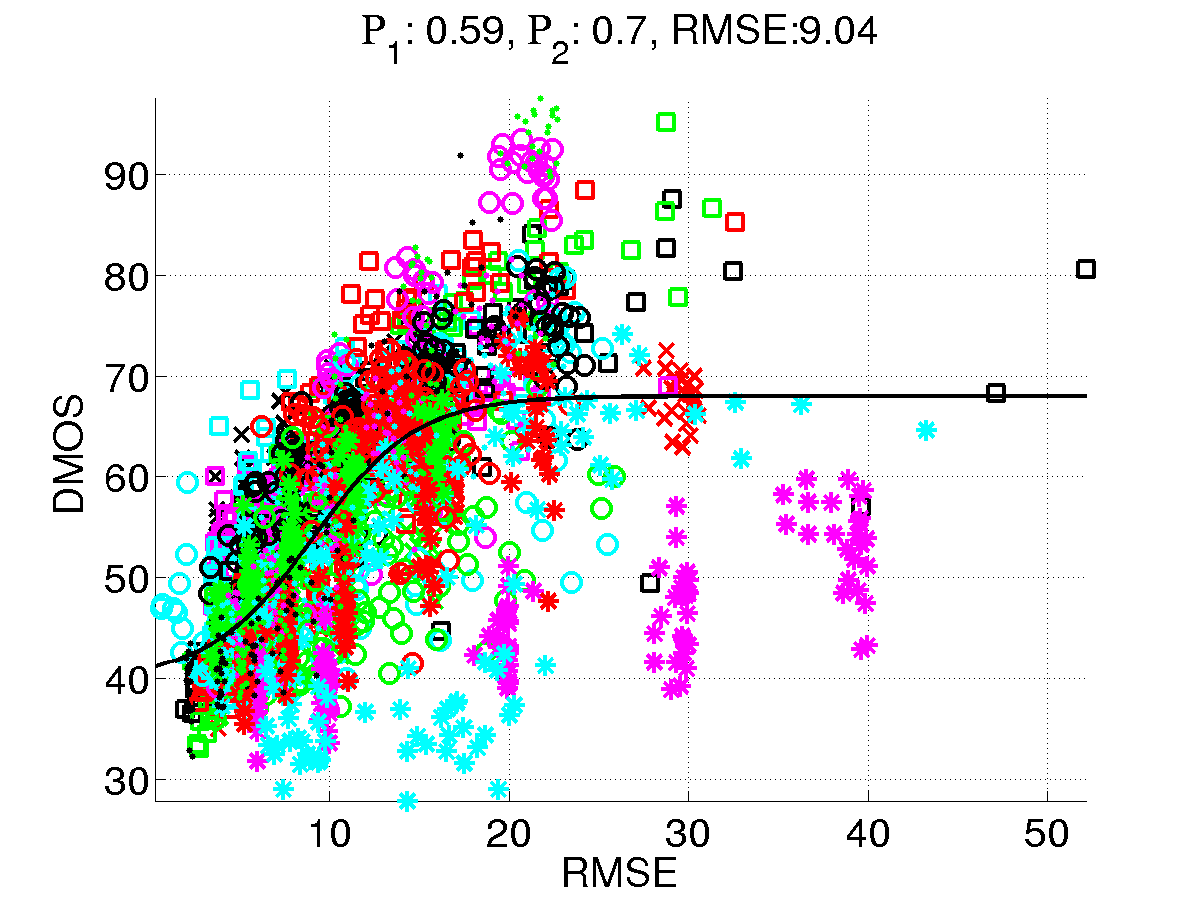
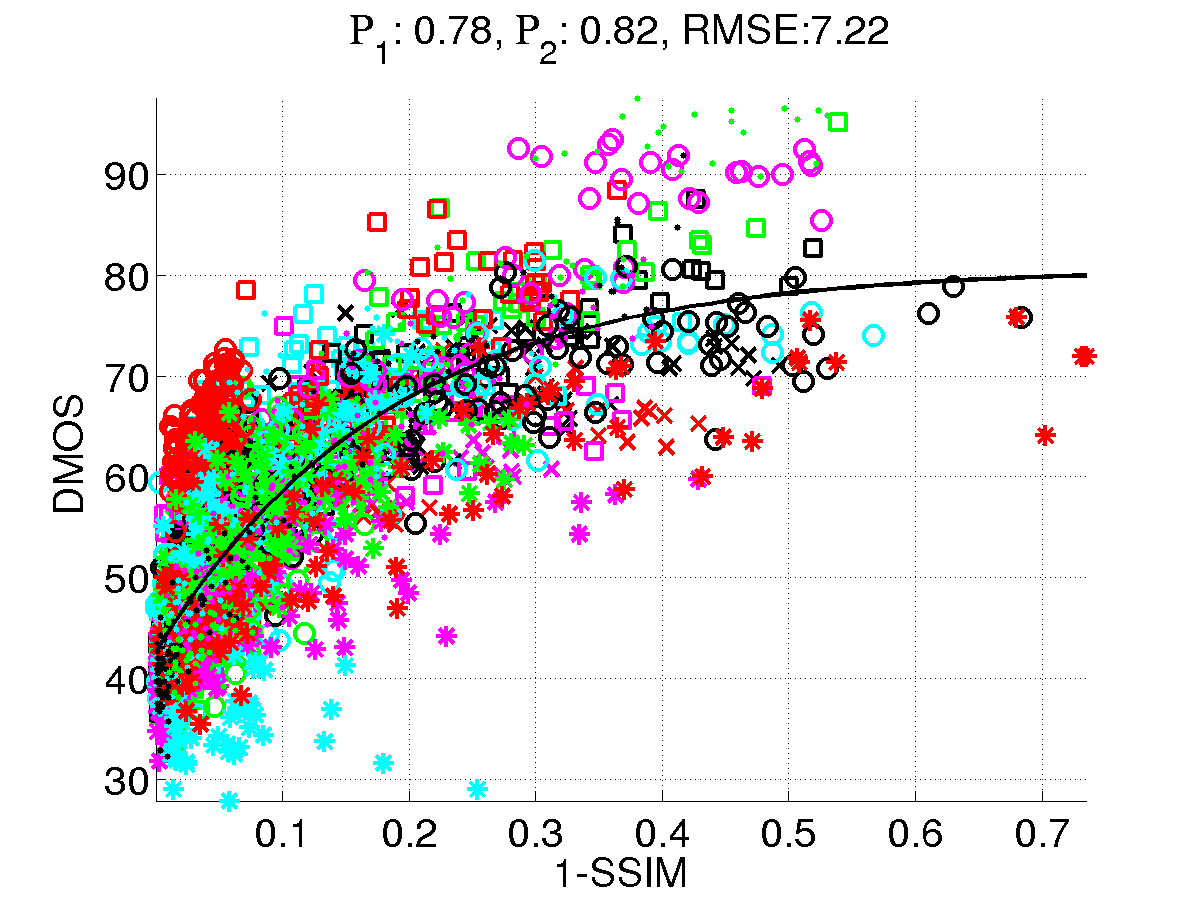
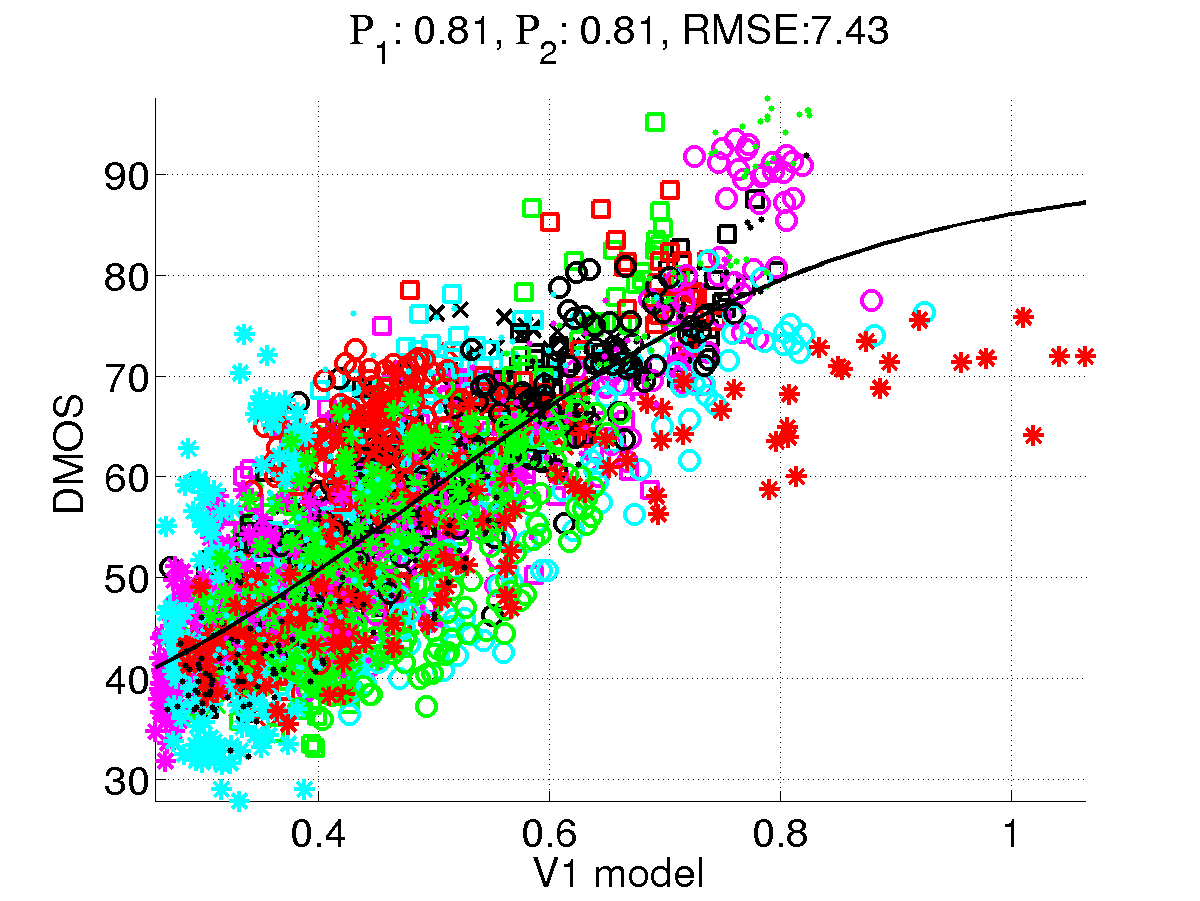
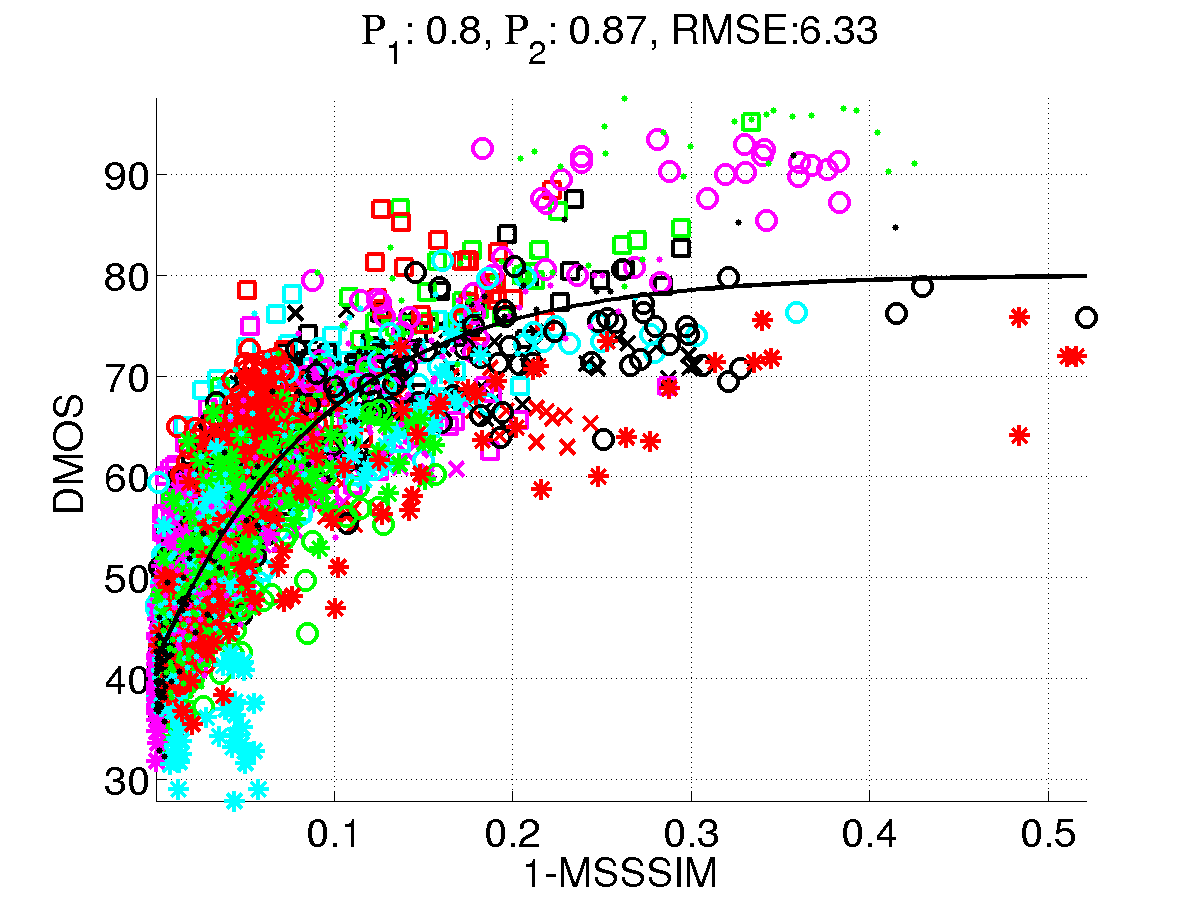
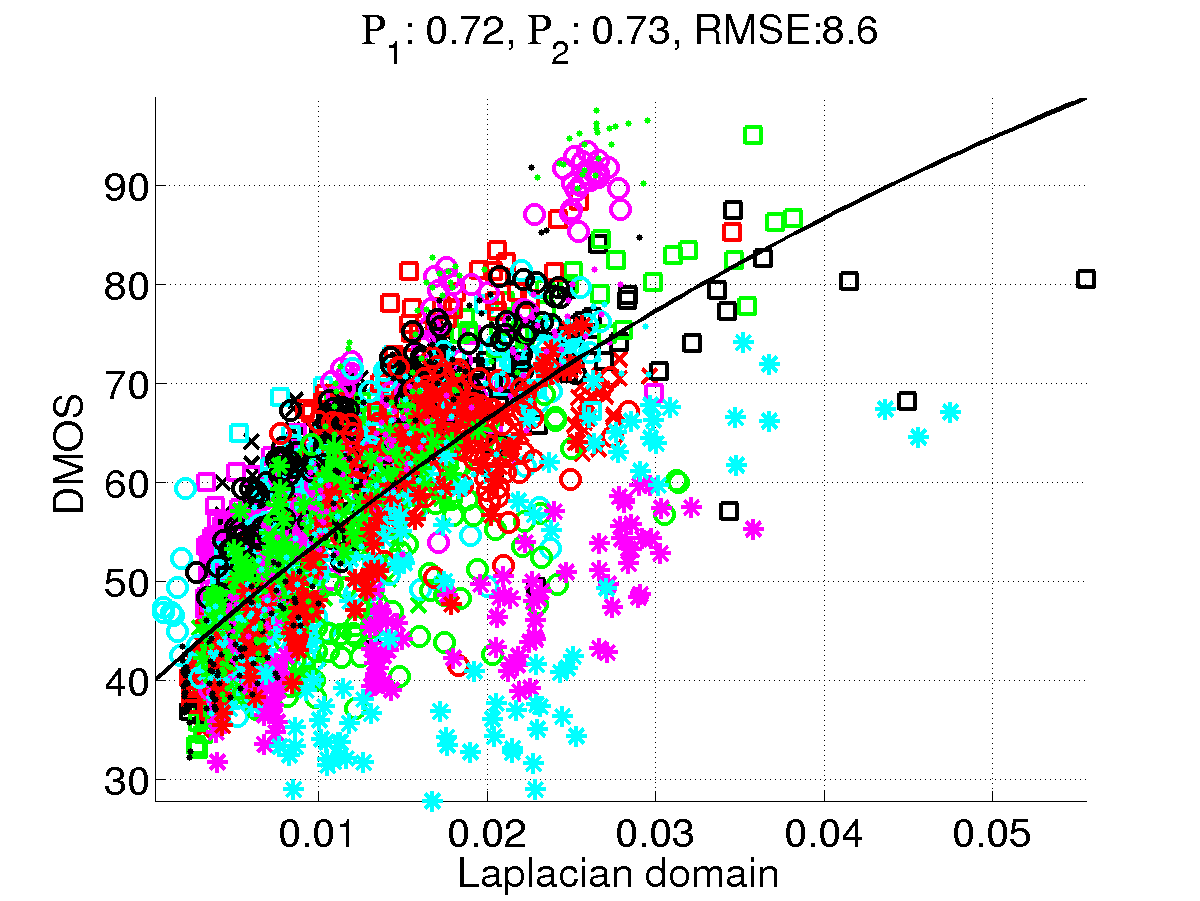
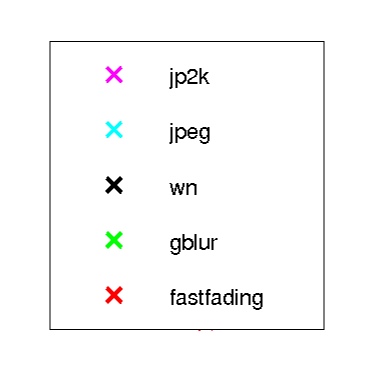
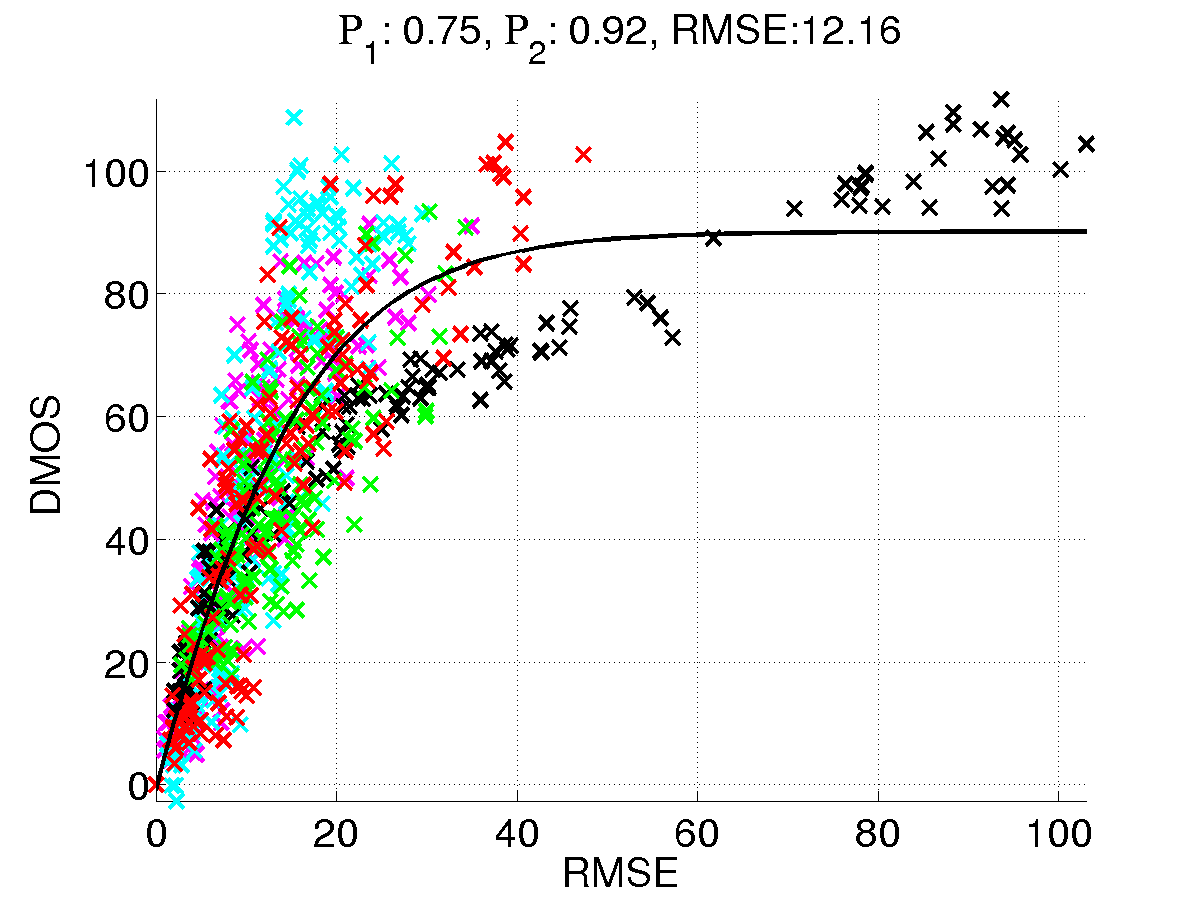
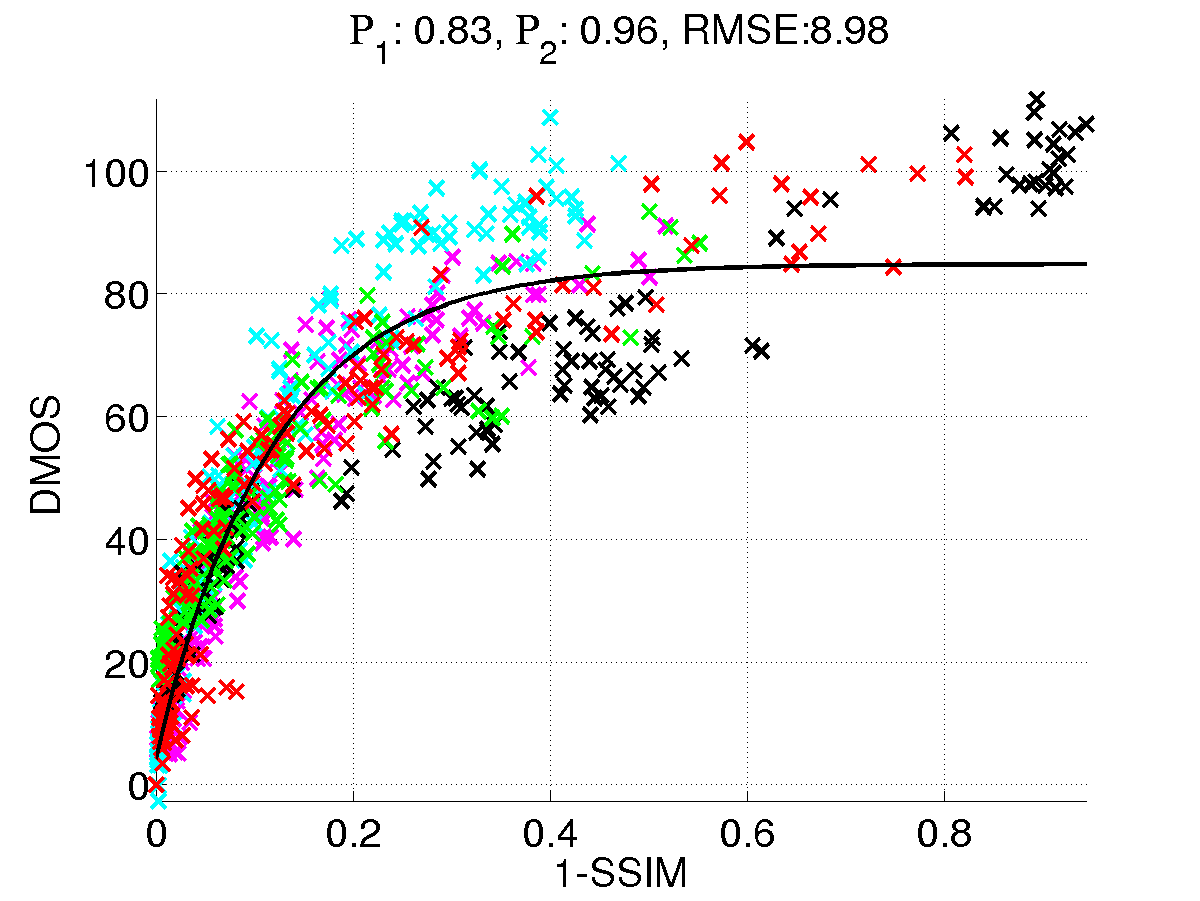
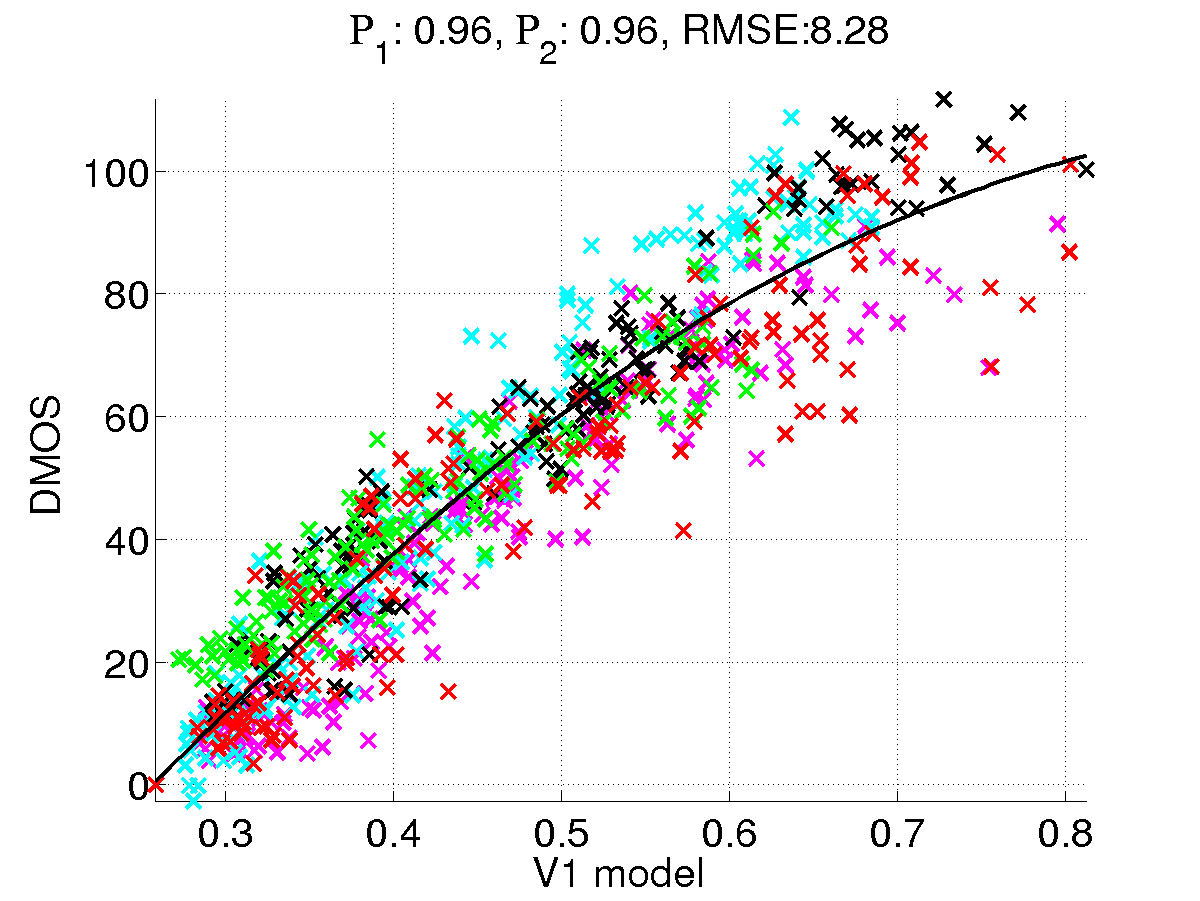
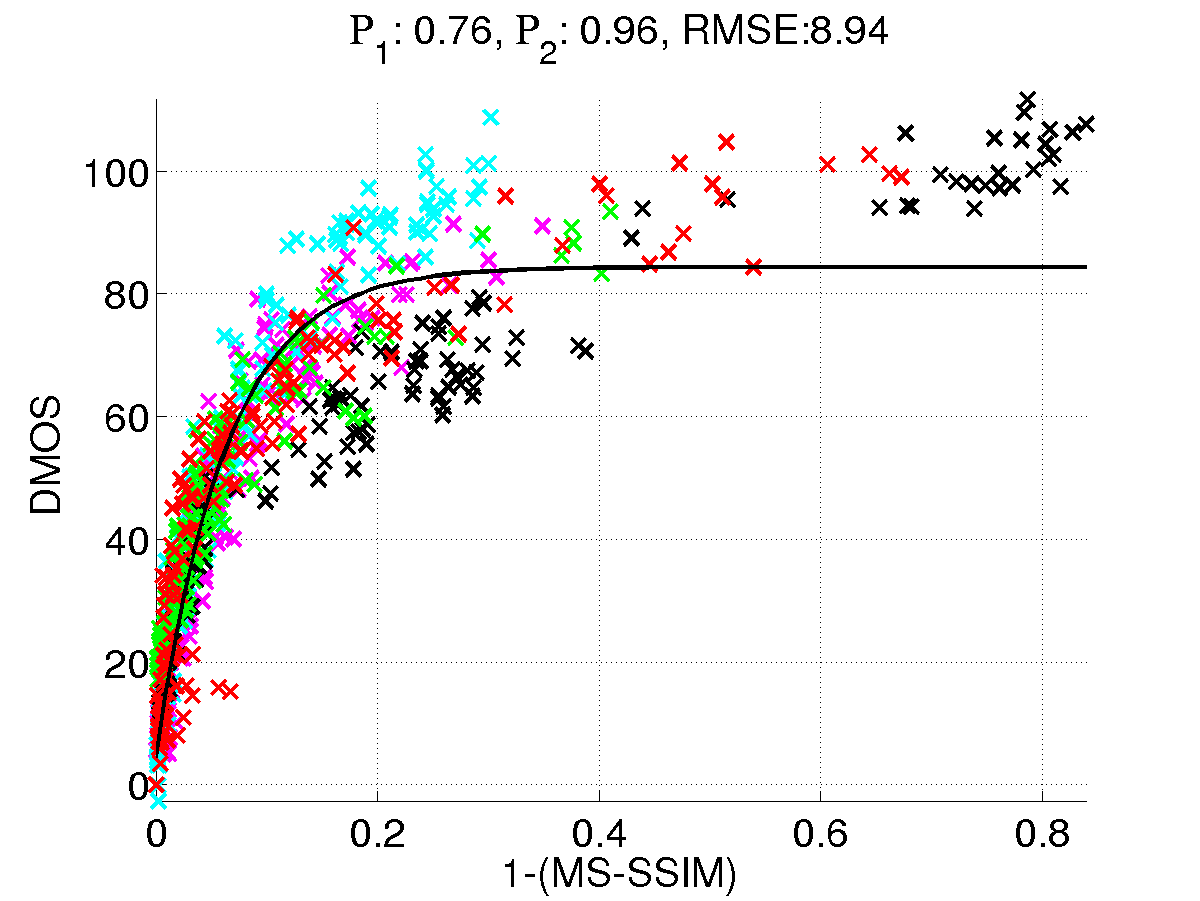
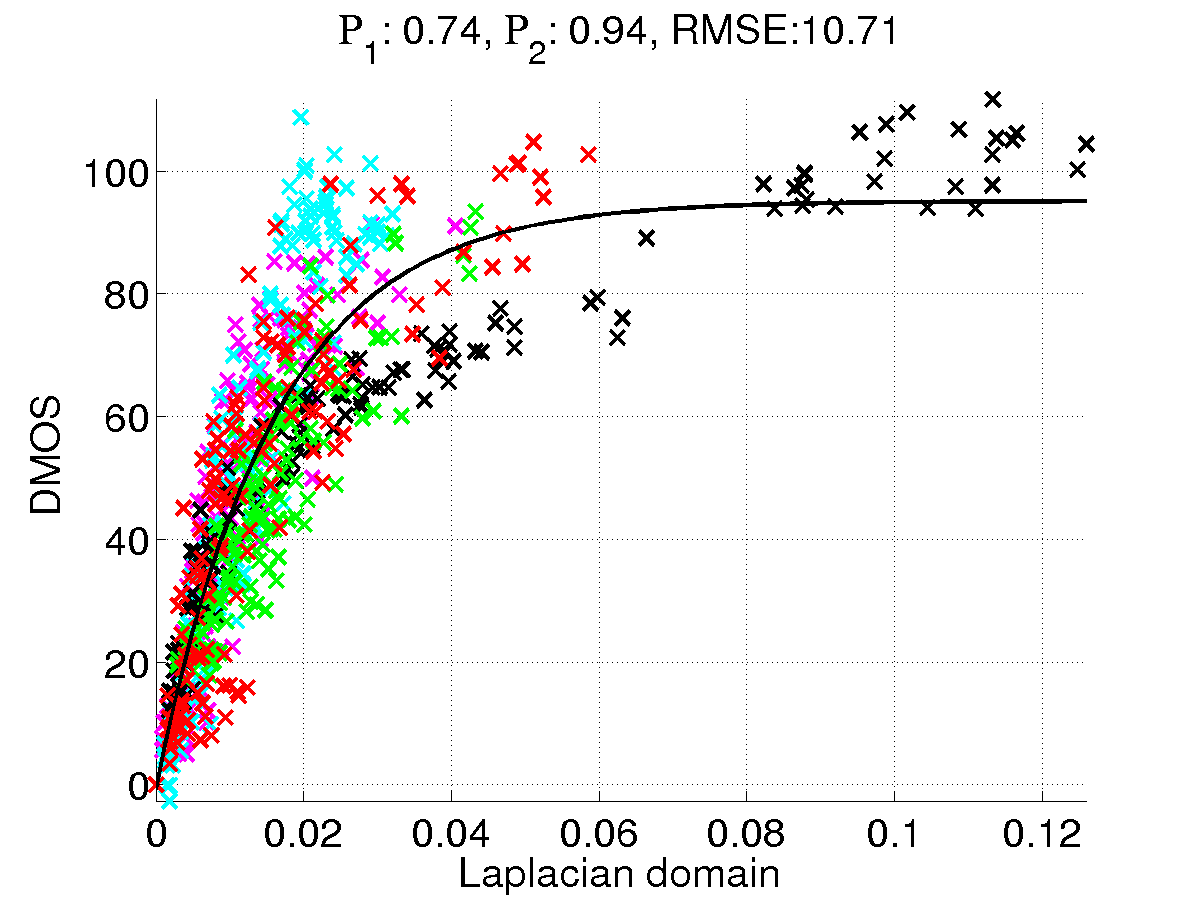
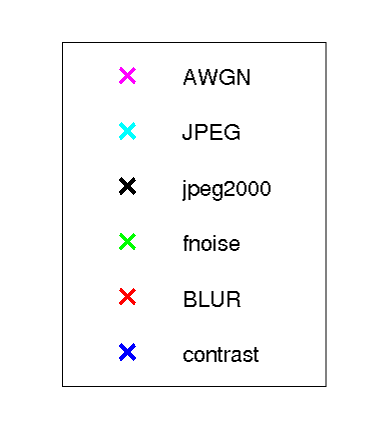
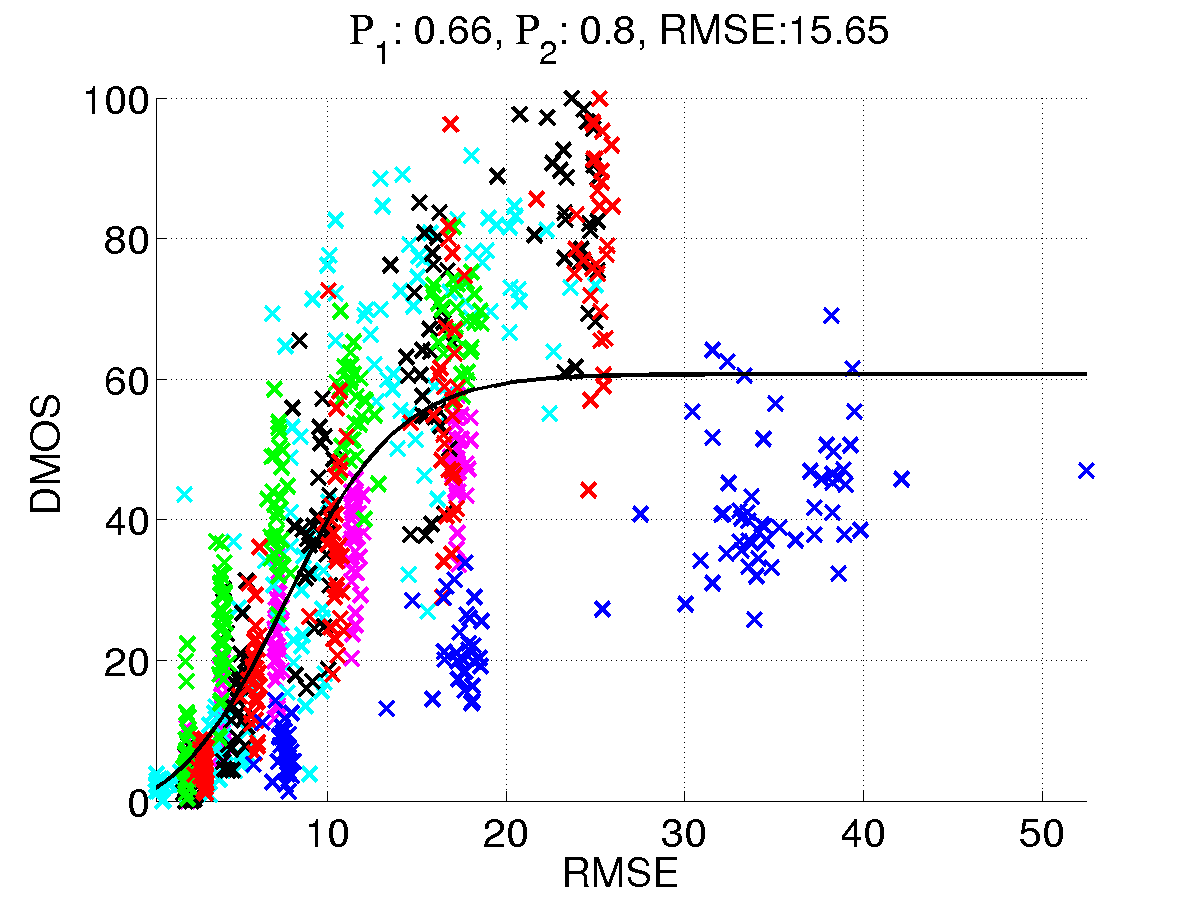
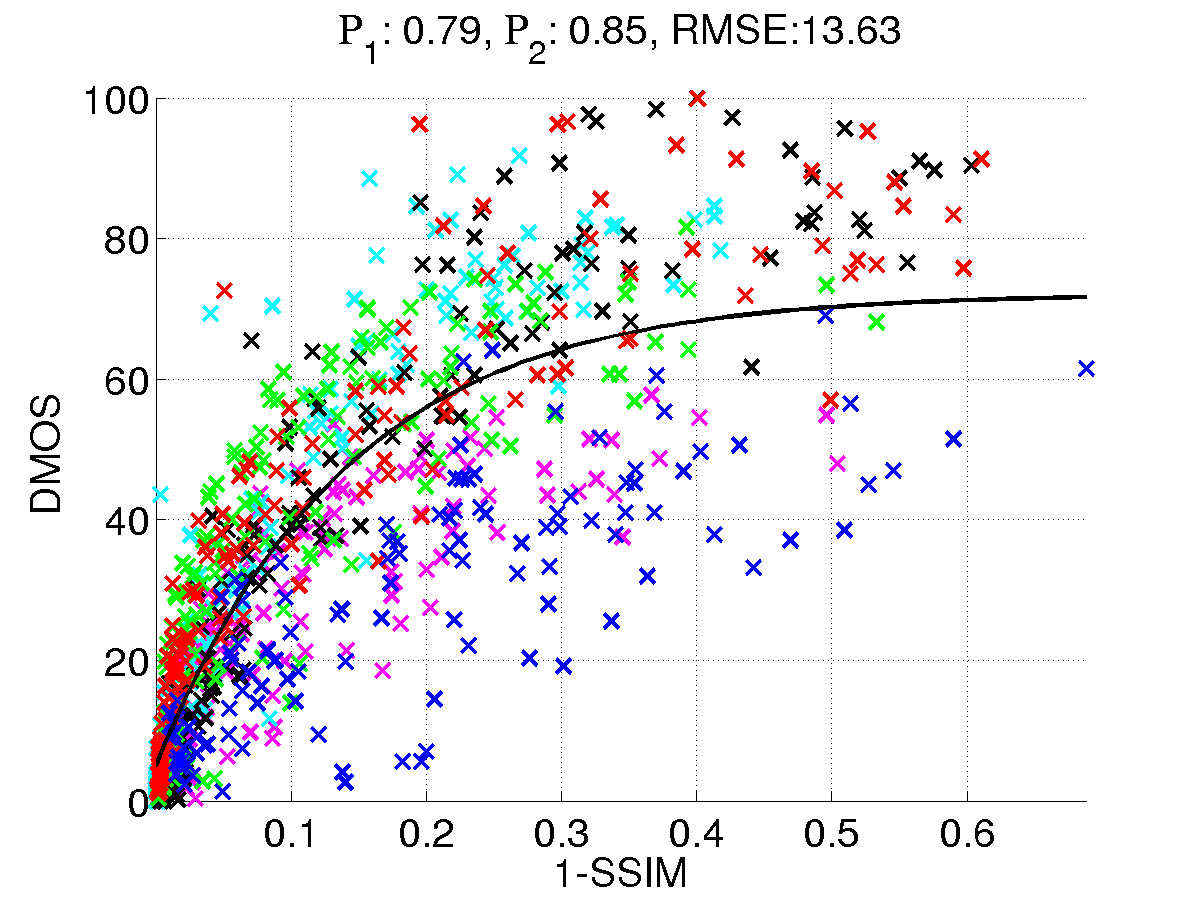
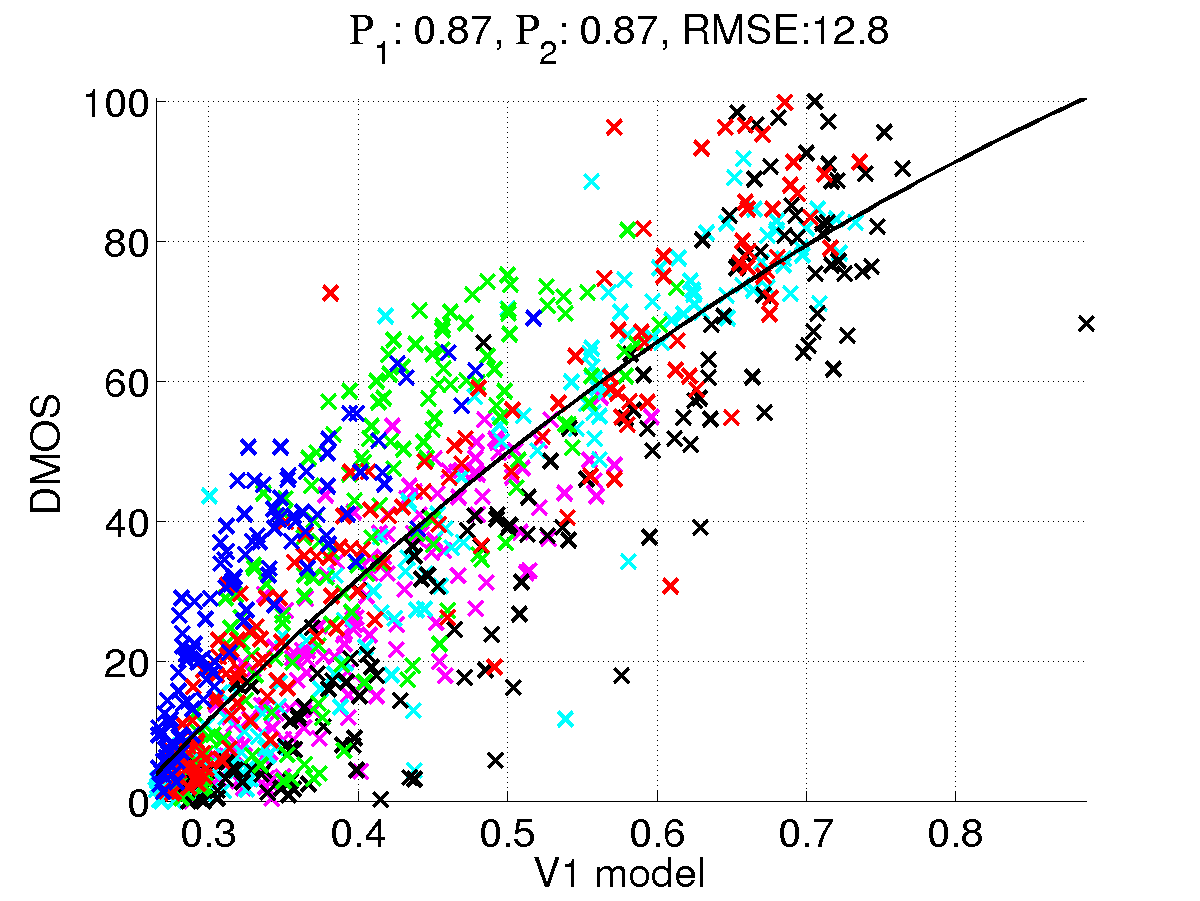
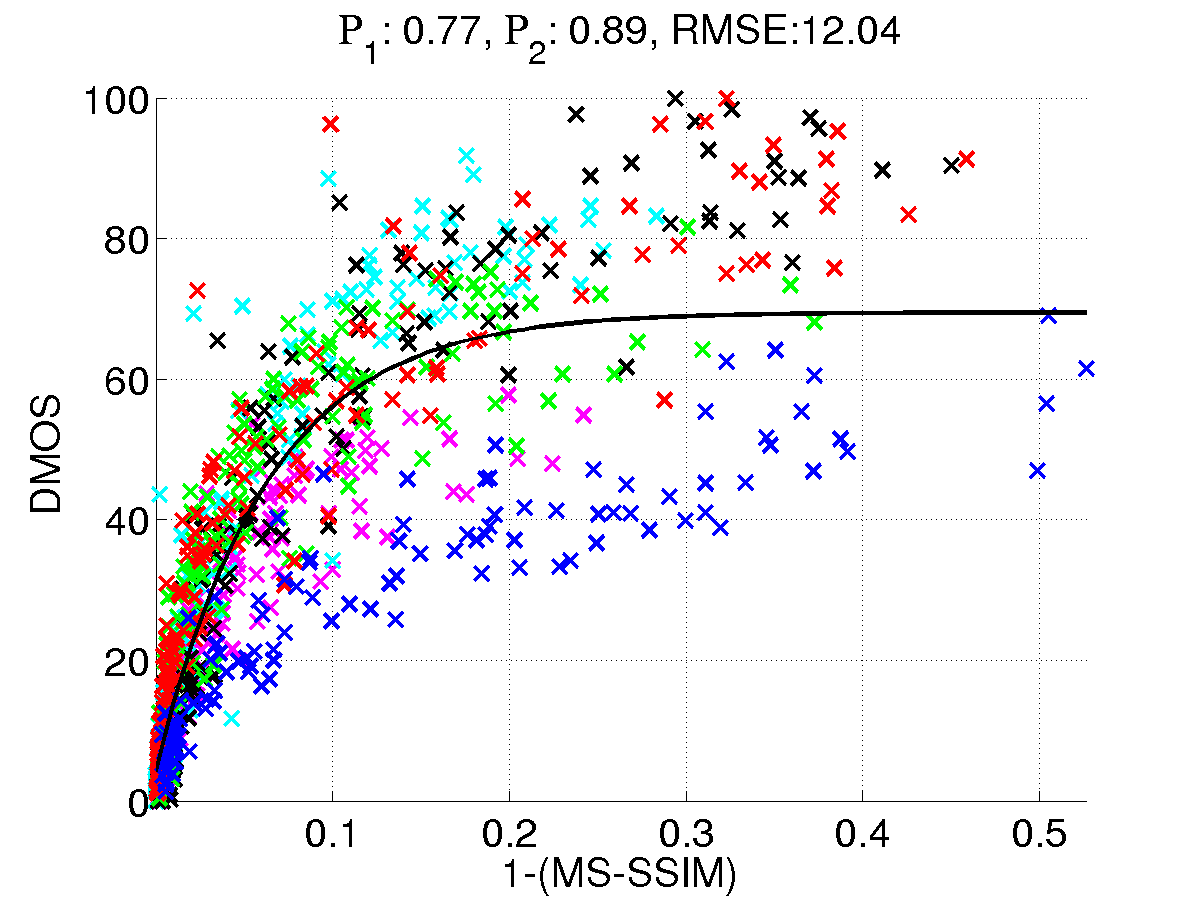
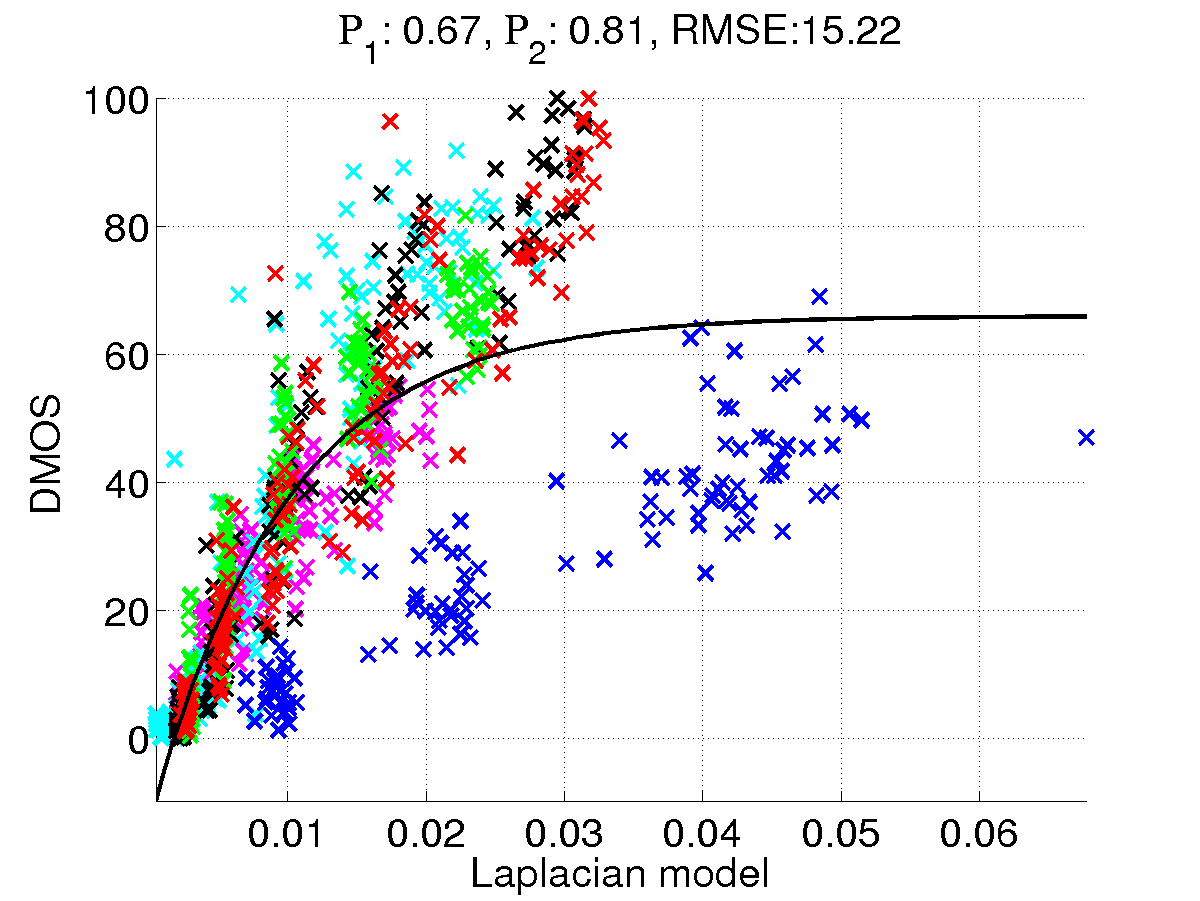
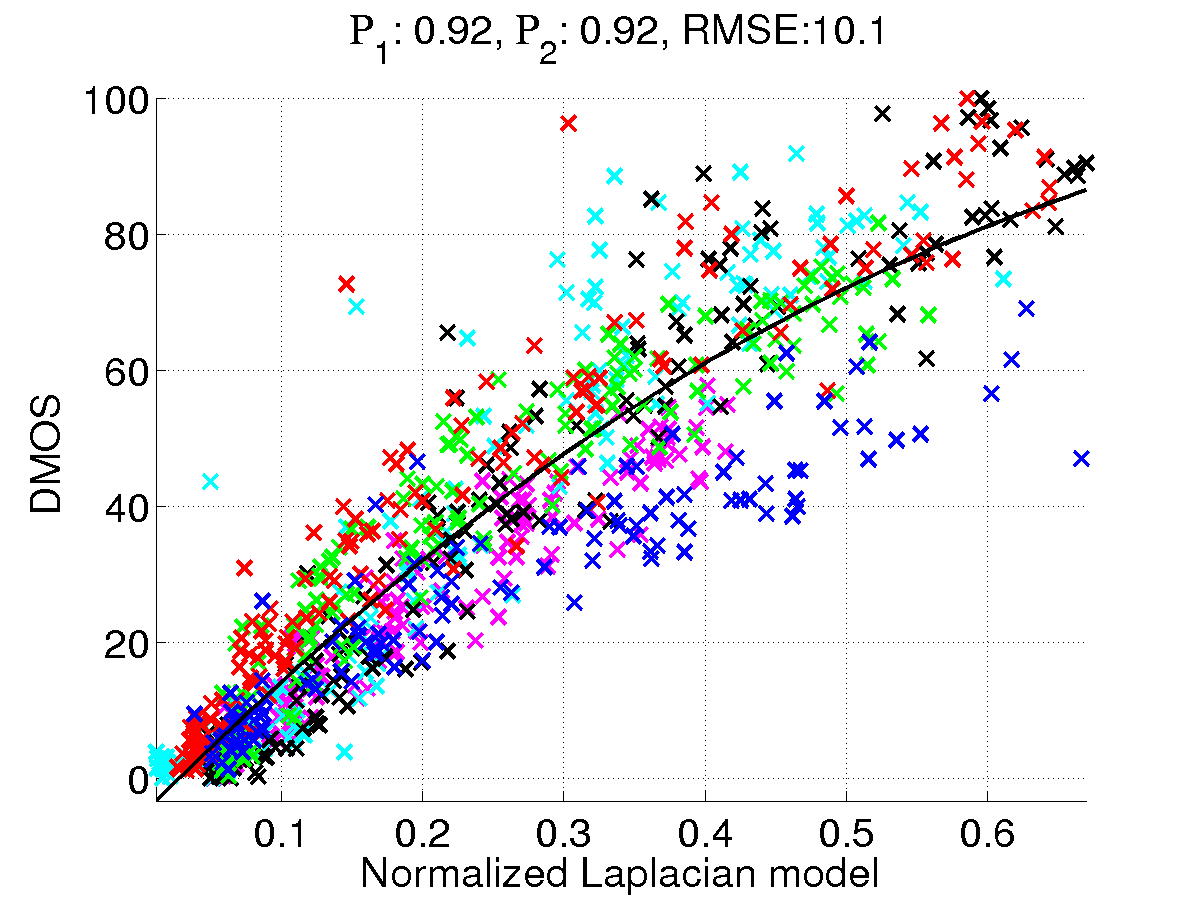
Top figure shows the legend for the different distortions in the plots. Each plot shows the DMOS prediction given by each method. Second row left: Root Mean Square Error (RMSE) in the image domain. Second row right: Structural Similarity Metric (SSIM). Third row left: V1 model. Third row right: Multi-scale Structural Similarity index (MS-SSIM). Fourth row left: Euclidean distance in the Laplacian domain. Fourth row right: Euclidean distance in the normalized Laplacian domain. Performance of each metric is summarized with three numbers (provided above each plot): the Pearson correlation before fitting a logistic function (P 1), the Pearson correlation (P 2) and the prediction error (RMSE) after fitting a logistic function (black line). First row right: root mean square error (RMSE) in the image domain.
Image Quality Assessment Results (on TID 2013 database)
 |
 |
 |
 |
 |
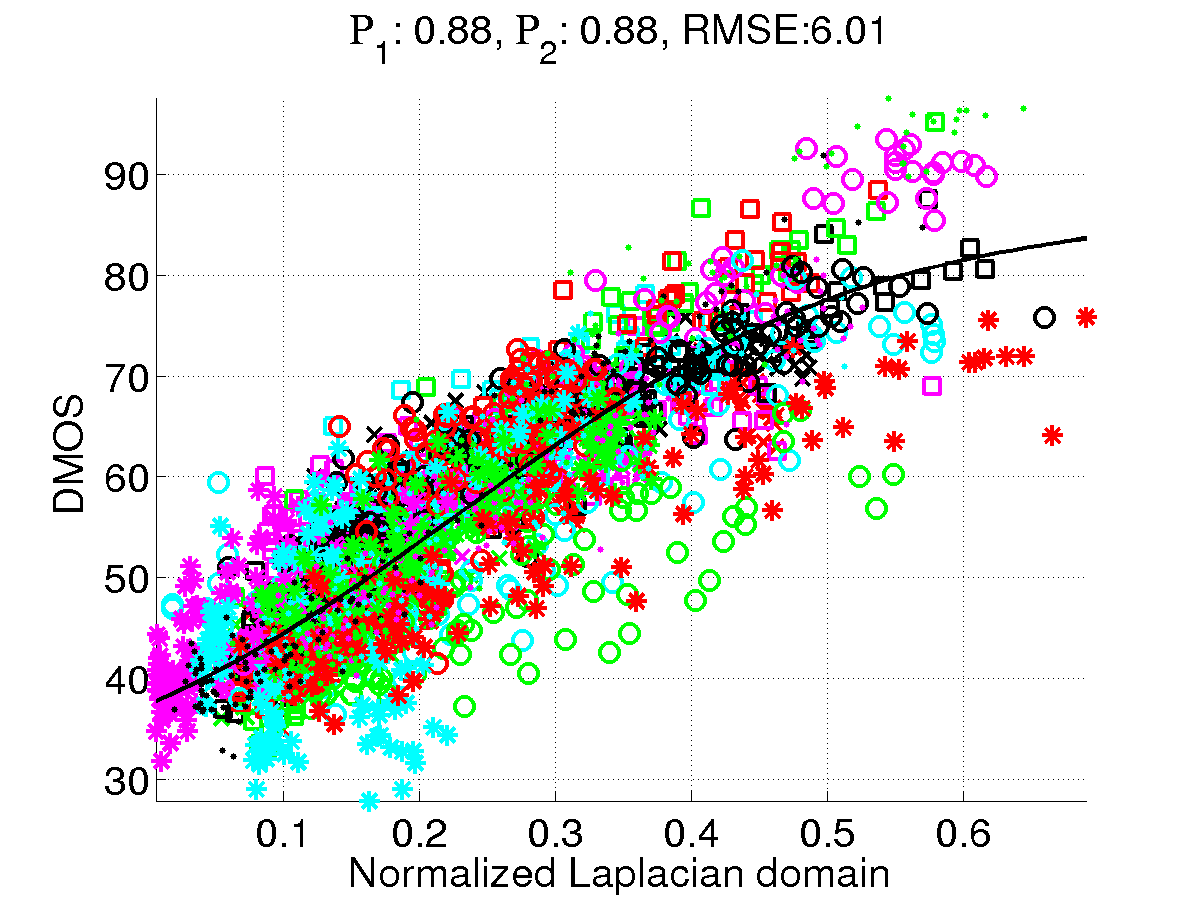 |
Top figure shows the legend for the different distortions in the plots. Each plot shows the DMOS prediction given by each method. Second row left: Root Mean Square Error (RMSE) in the image domain. Second row right: Structural Similarity Metric (SSIM). Third row left: V1 model. Third row right: Multi-scale Structural Similarity index (MS-SSIM). Fourth row left: Euclidean distance in the Laplacian domain. Fourth row right: Euclidean distance in the normalized Laplacian domain. Performance of each metric is summarized with three numbers (provided above each plot): the Pearson correlation before fitting a logistic function (P 1), the Pearson correlation (P 2) and the prediction error (RMSE) after fitting a logistic function (black line). First row right: root mean square error (RMSE) in the image domain.
Image Quality Assessment Results (on LIVE database)
 |
 |
 |
 |
 |
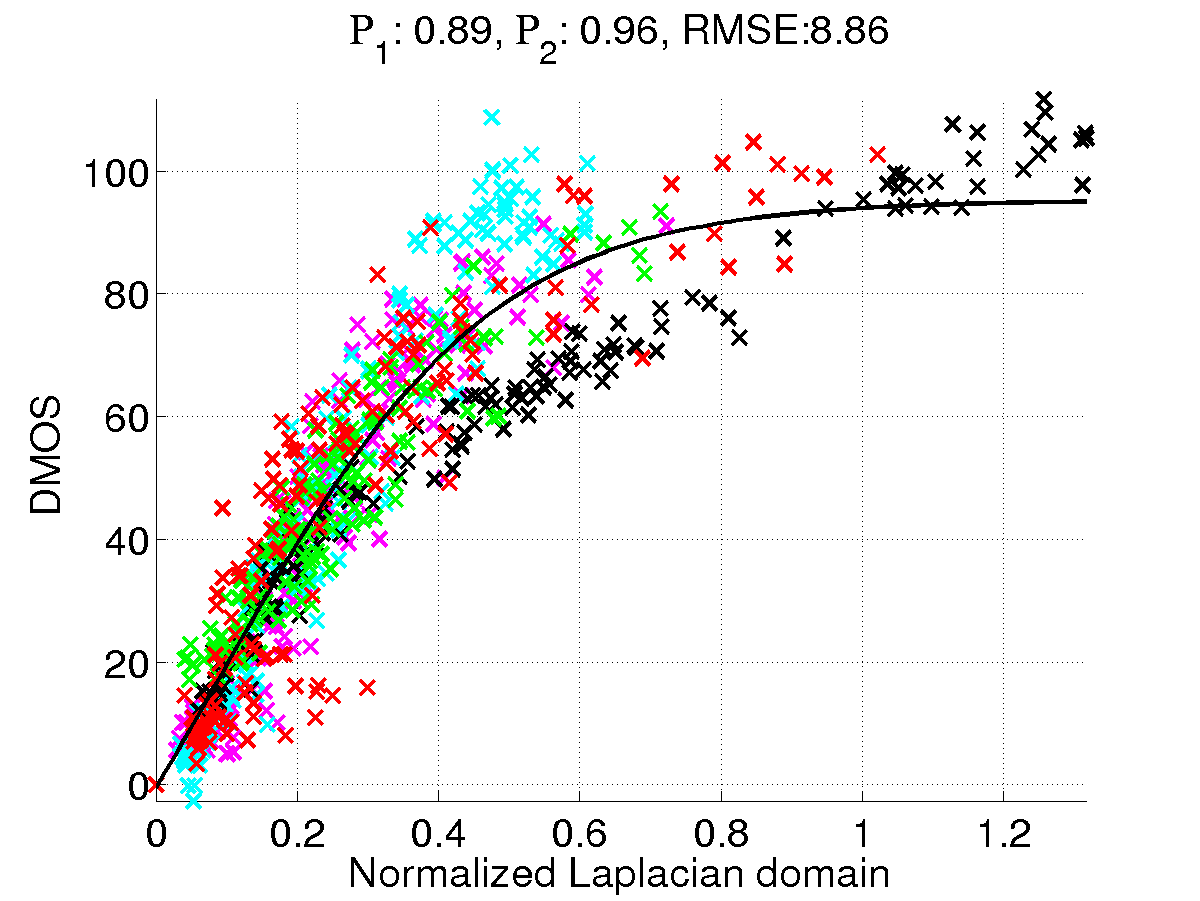 |
Top figure shows the legend for the different distortions in the plots. Each plot shows the DMOS prediction given by each method. Second row left: Root Mean Square Error (RMSE) in the image domain. Second row right: Structural Similarity Metric (SSIM). Third row left: V1 model. Third row right: Multi-scale Structural Similarity index (MS-SSIM). Fourth row left: Euclidean distance in the Laplacian domain. Fourth row right: Euclidean distance in the normalized Laplacian domain. Performance of each metric is summarized with three numbers (provided above each plot): the Pearson correlation before fitting a logistic function (P 1), the Pearson correlation (P 2) and the prediction error (RMSE) after fitting a logistic function (black line). First row right: root mean square error (RMSE) in the image domain.
Image Quality Assessment Results (on CSIQ database)
 |
 |
 |
 |
 |
 |
Top figure shows the legend for the different distortions in the plots. Each plot shows the DMOS prediction given by each method. Second row left: Root Mean Square Error (RMSE) in the image domain. Second row right: Structural Similarity Metric (SSIM). Third row left: V1 model. Third row right: Multi-scale Structural Similarity index (MS-SSIM). Fourth row left: Euclidean distance in the Laplacian domain. Fourth row right: Euclidean distance in the normalized Laplacian domain. Performance of each metric is summarized with three numbers (provided above each plot): the Pearson correlation before fitting a logistic function (P 1), the Pearson correlation (P 2) and the prediction error (RMSE) after fitting a logistic function (black line). First row right: root mean square error (RMSE) in the image domain.
Related Paper
Perceptual image quality assessment using a normalized Laplacian pyramid.
V. Laparra, J. Balle, A. Berardino, and E. P. Simoncelli
Submitted to Human Vision and Electronic Imaging Conference, August 2015
Download Code
