Lab 2 overview:
- Conditional statements: if, else
- Loops: for, while
- Avoiding loops by vectorizing
- Avoiding conditionals with logical indexing
- Functions: how to write your own function
Contents
- Conditional statements: if, else, end
- What sorts of conditions might we want to check?
- Check multiple conditions with "elseif"
- Brainstorm: When might we want to use a conditional in code?
- Repeating code without copy-and-paste
- When vectorizing isn't what we want
- For loops
- Using a for loop to solve the "make several plots" problem above
- Style note: good variable names; "magic numbers"; whitespace
- You can use the "index variable" just to count
- Note on index variable naming
- While loops
- Avoid loops by vectorizing
- Use element-wise operators to avoid looping through a vector
- Use "repmat" to make copies of a vector to help work with matrices
- Vectorizing your conditionals
- Logical indexing
- When should I use a for loop?
- Vectorization practice: compute the dot product
- More vectorization practice: simulate an experiment
- Practice continued: a multi-trial experiment
- Practice continued: find the trials where the error was really bad
Conditional statements: if, else, end
So far we only know how to run one statement after another. All statements in our scripts get run every the time. What if we want some statements to only run under certain conditions? Answer: use a conditional!
The following shows a demo of how "if/else" (conditional) syntax works. The condition will be checked. If it's true, the first block of code will be run. If it's false, the second block of code will be run. Under no circumstances will both blocks be run.
x = 1; % Try changing this value and running the block
if x > 5
    display('a is greater than 5');
else
    display('a is less than or equal to 5');
end
a is less than or equal to 5
What sorts of conditions might we want to check?
x = 10;

x > 0 % is x positive?
x == 2 % is x equal to 2?
mod(x, 2) == 0 % is x divisible by 2? ("mod" is like "remainder")

% These statements output 0 if false, or 1 if true
ans =

     1


ans =

     0


ans =

     1
Check multiple conditions with "elseif"
Each condition will be checked one after another.
As soon as one condition is found to be true, the other conditions will not be checked, even if they are also true. Under no circumstances will more than one block of code be run.
x = 1;
if x > 5
    display('a is greater than 5');
elseif x > 0
    display('a is less than or equal to 5, and greater than 0');
else
    display('a is less than or equal to 0');
end
a is less than or equal to 5, and greater than 0
Brainstorm: When might we want to use a conditional in code?
- Running an experiment?
- If the key the user pressed was "Esc", then exit
- Check the time since stimulus onset; if it is >500ms, change the stimulus
- Analyzing data?
- User data: analyze the correct responses separately from the incorrect responses
- fMRI data: look at only voxels that are in V1
- Spike data: if a spike occurs, grab the previous 100ms of stimulus
- Visualizations: Set "graphsOn = true", later check "if graphsOn" to show or hide figures
- Checking for code correctness?
- Load a data file; check it's the right size before you start analyzing
Repeating code without copy-and-paste
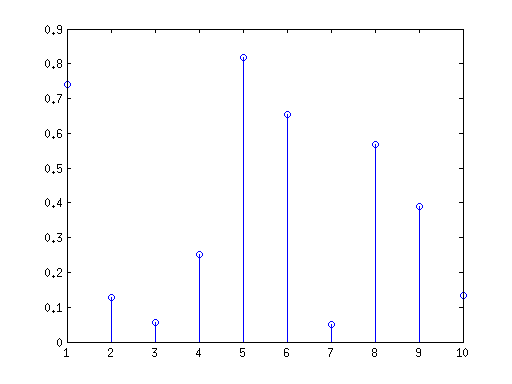
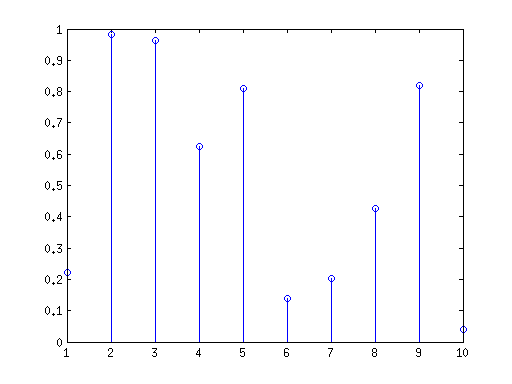
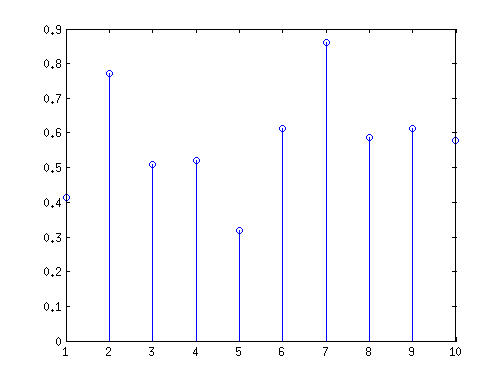
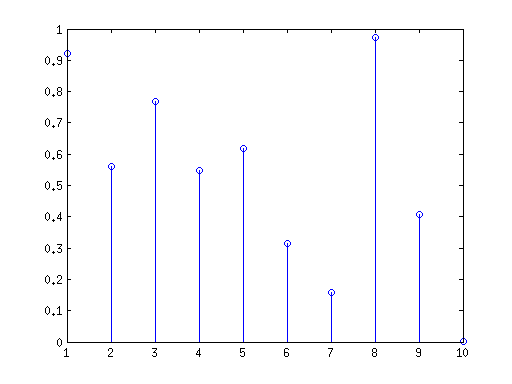
Let's say we want to visualize several vectors:
nVec = 3;
vecLength = 10;

vecs = rand(vecLength, nVec);
% Quick check: are these vectors row vectors or column vectors?
% Notice how the use of descriptive names makes it easier to tell than if we
% had instead written rand(10, 3).

% Display the vectors:
figure; stem(vecs(:, 1));
figure; stem(vecs(:, 2));
figure; stem(vecs(:, 3));
% This is inefficient. What if we had 10 vectors? 100? What if we change
% "nVec" above?


When vectorizing isn't what we want
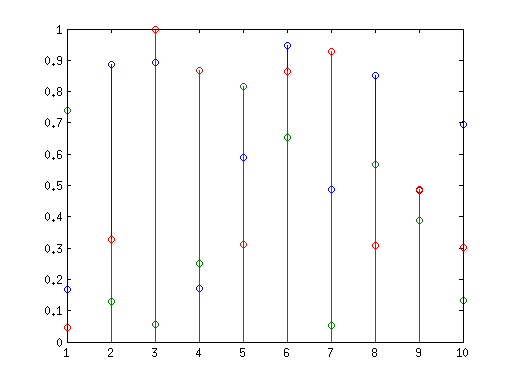
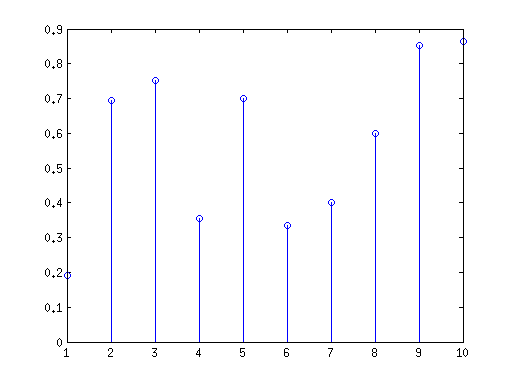
If you look at the help for "stem" you can see that it will happily make one plot with a new series for each column in a matrix, but what if we really do want separate plots, above, not one big plot?
stem(vecs); % This is nice, but it isn't what we want
For loops
Use a "for loop" to step through different values of a variable. In this example, we step through x = 1, x = 2, ... x = 5. Each time we go through the loop, we run the same block of code with the new x value.
for x = 1:5
    display(x)
end
x =

     1


x =

     2


x =

     3


x =

     4


x =

     5
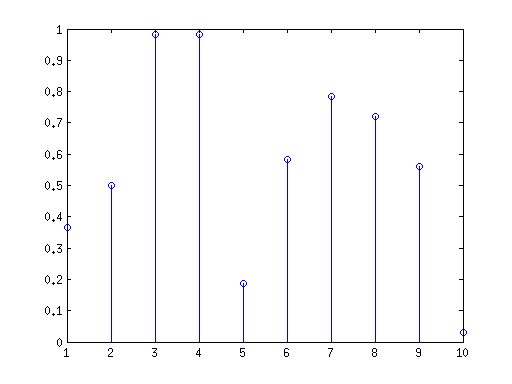
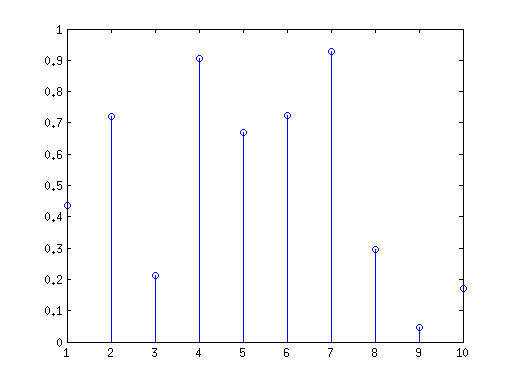
Using a for loop to solve the "make several plots" problem above
close all;

% Generate vectors
nVec = 3;
vecLength = 10;
vecs = rand(vecLength, nVec);

% Plot vectors
for col = 1:nVec
    figure; stem(vecs(:, col));
end
Style note: good variable names; "magic numbers"; whitespace
- Compare and contrast the code above with the code below
- Descriptive variable names like "vecLength" are better than just writing "10" because you know why 10 is the right number there.
- The term for an inexplicable number hard-coded into your code is a "magic number". Avoid magic numbers! Give all your numbers names!
- Using variables also means you only have to make changes in one place, rather than finding all the places to make changes.
- Indentation and line breaks help understand the structure of code
- Comments help explain the purpose and organization of code blocks
close all;
a = rand(10, 3);
for b = 1:3
figure; stem(a(:, b));
end
You can use the "index variable" just to count
Here the variable "i" is used just to count n times through the loop, and we're changing a different variable "b" as we go along
b = 0;
n = 5;
for i = 1:n
    b = b + 2;
    display(b);
end
b =

     2


b =

     4


b =

     6


b =

     8


b =

    10
Note on index variable naming
It's common in most programming languages to use "i" as the index variable when you're using it just to count. However, in MATLAB this overwrites the imaginary number. I still choose to use "i" in my loops, and to use "sqrt(-1)" when I need the imaginary number. You may have a different preference.
While loops
A "while" loop is similar to a for loop, but it stops after a condition gets met, rather than after a set number of loops. This is useful if you don't know how many loops you'll need. For example, if you're running an iterative algorithm and waiting for it to converge; generating random samples until you find one you like; waiting for the user to input the right value; etc.
% Count down from 100 in random intervals, stop when we hit or pass 0:

x = 100;
numIter = 0;
while x > 0
    x = x - randi(10);
    numIter = numIter + 1;
end
display(['Stopped after ', num2str(numIter), ' iterations']);
Stopped after 21 iterations
Avoid loops by vectorizing
In the "stem" example above, we really did have to use a loop to call the "figure" command multiple times. But "for" loops are slow in MATLAB. If your goal is to operate on multiple elements of a vector, or multiple rows/columns of a matrix, you can almost always avoid using a for loop by "vectorizing" the operation: that is to say, by operating on all the elements of the vector at once, or all the rows/columns of the matrix at once. This can take some thinking!
As a rule, if you're writing a for loop, ask yourself: am I operating on multiple numbers/vectors/matrices one after another? Can I rewrite this to do all the operations at once?
Use element-wise operators to avoid looping through a vector
Example: find the square of each element in a vector
% For loop:
vec = rand(1, 10);
squares_go_here = zeros(1, size(vec, 2)); % an empty vector to be filled in
for i = 1:size(vec, 2)
    squares_go_here(i) = sqrt(vec(i));
end

% Vectorized:
squares_vec = sqrt(vec);
Use "repmat" to make copies of a vector to help work with matrices
vec = [1:3]'
mat = [1:4; 5:8; 9:12]

% How do we divide every column in the matrix by this one column vector?

denom = repmat(vec, 1, size(mat, 2))
quotient = mat ./ denom

% "Repmat" will make concatenated copies of a matrix. We asked for just one
% copy in the first/row dimension (don't repeat the rows), and multiple
% copies in the second/column dimension (repeat this column over and over).
vec =

     1
     2
     3


mat =

     1     2     3     4
     5     6     7     8
     9    10    11    12


denom =

     1     1     1     1
     2     2     2     2
     3     3     3     3


quotient =

    1.0000    2.0000    3.0000    4.0000
    2.5000    3.0000    3.5000    4.0000
    3.0000    3.3333    3.6667    4.0000
Vectorizing your conditionals
What if you want to operate on only every fifth element of the vector? Or only the even numbers in your vector? Don't you have to loop through the vector and check the conditional every time?
No! You can vectorize your conditionals!
n = 12; mx = 10;
x = randi(mx, 1, n);

display('Is each element in x greater than 5?');
[x; x > 5]

display('Any?')
any(x > 5)

display('All?')
all(x > 5)

display('Which indices?')
idx = find(x > 5)

display('Get the elements at those indices');
x(idx)
Is each element in x greater than 5?

ans =

     4     4     5     2     8     5     5    10     1     7     2     2
     0     0     0     0     1     0     0     1     0     1     0     0

Any?

ans =

     1

All?

ans =

     0

Which indices?

idx =

     5     8    10

Get the elements at those indices

ans =

     8    10     7
Logical indexing
When we write "x(find(x>5))", we are saying "Give us a vector of 1's and 0's as long as x which tells us where the elements we want are; find the indices of the 1's; then get the elements of x at those positions." Using logical indexing, we can skip the "find" step, and just exract the elements at "1" and leave behind the elements at "0". MATLAB actually understands a matrix 1's and 0's as a list of "take this one, leave that one" if the matrix is the same size as the matrix to index into. Like this:
x

display('Get the elements of x that are greater than 5')
x(x>5)

display('Get only the even-indexed elements');
x(mod(1:length(x), 2)==0)
x =

     4     4     5     2     8     5     5    10     1     7     2     2

Get the elements of x that are greater than 5

ans =

     8    10     7

Get only the even-indexed elements

ans =

     4     2     5    10     7     2
When should I use a for loop?
- When your function or operation is not vectorized, or you don't want to invoke its vectorized behavior (e.g. creating multiple separate figures)
- When accumlating experimental data in real-time, trial-by-trial (user keypresses; recorded spikes; etc.)
- When you can't figure out how to write it without the loop, and it is a better use of your time to just write something "good enough for now" than to get stuck trying to write "perfect code". Seriously! Don't get so focused on correctness that you feel paralyzed.
- When vectorizing requires an unreadable combination of "repmat" and "reshape" and "bsxfun", and readability is more important than speed.
Vectorization practice: compute the dot product
n = 10;
x = rand(1,n);
y = rand(1,n);

% For loop:
d_product_for = 0;
for i = 1:n
	 d_product_for = d_product_for + x(i)*y(i);
end

% Vectorized:
zip = x .* y;
d_product_vec = sum(zip);

d_product_vec = sum(x.*y); % Same thing, just as a single statement

% Using the "dot" function:
d_product_dot = dot(x, y);

% Using matrix multiplication:
d_product_mult = x * y';

% Verify that these dot products all came out to the same number!
More vectorization practice: simulate an experiment
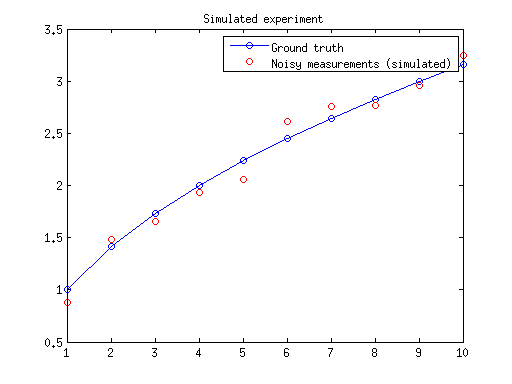
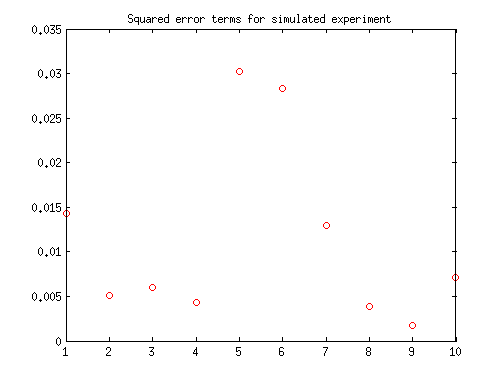
Assume there is a true underlying relationship between the indepedent variable x and the dependent variable y, where y = sqrt(x). Let's simulate taking noisy measurements of the ground truth, and use vectorization to quickly and easily compute the squared error of each mesaurement.
% Create ground truth y values
x = [1:10]';
groundTruth = sqrt(x);

% Simulate one set of noisy measurements of the ground truth
noiseStd = 0.1;
measured = groundTruth + noiseStd*randn(length(x), 1);

% Plot the simulated data we created
figure; plot(x, groundTruth, 'bo-', x, measured, 'ro'); title('Simulated experiment');
legend('Ground truth', 'Noisy measurements (simulated)');

% How do we find the squared error term at each point without a for loop?
squaredErrors = (measured-groundTruth).^2;
figure; plot(squaredErrors, 'ro'); title('Squared error terms for simulated experiment');
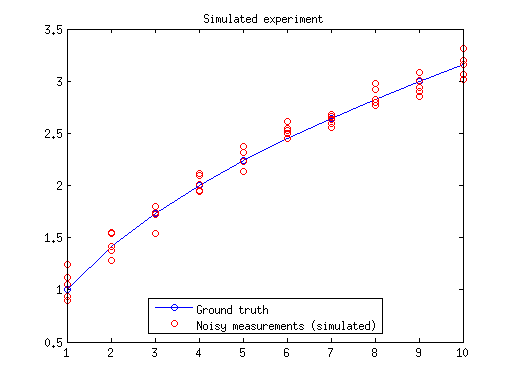
Practice continued: a multi-trial experiment
(Use "repmat" to vectorize a matrix operation)
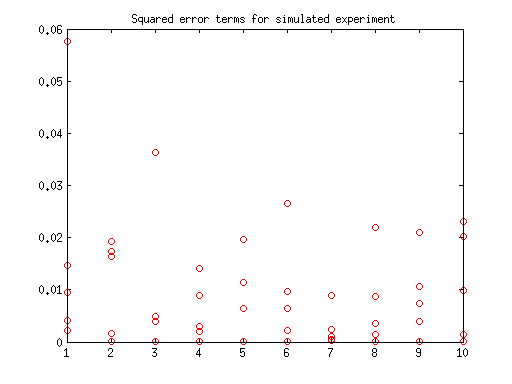
close all;

nTrials = 5;

noise = noiseStd*randn(length(x), nTrials);
measured = repmat(groundTruth, 1, nTrials) + noise;

% Plot the simulated data we created
figure; plot(x, groundTruth, 'bo-', x, measured', 'ro'); title('Simulated experiment');
legend('Ground truth', 'Noisy measurements (simulated)', 'Location', 'Best');

% Compute squared error term for each trial
errors = measured - repmat(groundTruth, 1, nTrials);
squaredErrors = errors.^2;
figure; plot(squaredErrors, 'ro'); title('Squared error terms for simulated experiment');
Practice continued: find the trials where the error was really bad
(Use vectorized conditionals and logical indexing!)
badTrials = errors > 1.5*std(errors(:))
worstSquaredErrors = squaredErrors(badTrials)
badTrials =

     1     0     0     0     0
     0     0     0     0     0
     0     0     0     0     0
     0     0     0     0     0
     0     0     0     0     0
     0     0     0     1     0
     0     0     0     0     0
     0     1     0     0     0
     0     0     0     0     0
     0     1     0     0     0


worstSquaredErrors =

    0.0577
    0.0219
    0.0231
    0.0265