Lab 1 overview:
- What's MATLAB? Why MATLAB?
- Interface
- Variables
- Matrices and vectors: creation and access
- Built-in functions
- Operating on matrices and vectors
- Plotting
- Saving your work as a script
Contents
- What's MATLAB? Why MATLAB?
- Introduction to Matlab - Interface
- MATLAB as Calculator
- Variables
- Workspace
- Matrix and vector creation: basics
- EXERCISE
- Vector access
- Matrix access
- EXERCISE
- Errors in matrix creation and access
- Functions
- Getting help
- An important aside about notation
- Matrix/vector creation: using functions
- Concatenating matrices
- Vector math
- Inner product
- Outer product
- Element-wise operations
- Summary statistics
- Plotting
- Plotting multiple lines on the same axis
- More visualizations: histograms and scatterplots
- Scripts
What's MATLAB? Why MATLAB?
MATLAB is a programming language and an environment.
Why code in general? You can write your own analyses.
Why use code in this course? So you can try out the math. Visualize it. Make it concrete. It's another learning tool.
Why MATLAB, not a different language? * Common in the field * Interpreted - see results immediately * Data visualization
Introduction to Matlab - Interface
Let's familiarize ourselves with the MATLAB interface. Work by typing these commands into the interpreter: the window with the line starting with ">>". Type your commands after ">>" and hit enter.
MATLAB as Calculator
% Copy these lines to the prompt (">>" in the other window) and run them
% one at a time:
3+4
5-9
4*6
5*(3+4)
26/5
5^2
pi

% You can use the "up" arrow at the prompt (">>") to go back to previous
% commands you typed.
%
% If you start typing and then use the up arrow before you're done, it will
% find you all past commands that start with the letters you just typed.
ans =

     7


ans =

    -4


ans =

    24


ans =

    35


ans =

    5.2000


ans =

    25


ans =

    3.1416
Variables
We can assign values to variables with =
a = 7;
a
% Now, the value of our variable "a" won't change...
a + 1;
a + 1;
a
% ... unless we re-assign a value to it
a = 41;
a

% Can we assign a variable to another variable? What happens?
b = a;
b

c = a + 1;
c

% If b = a, then what happens when we change a?
a = 10;
b
c

% The way this works is that MATLAB has a lookup table. When you type
% something, like "a", it looks in the lookup table for the associated
% value. When you type "a = 1", it puts "1" in the lookup table as the
% value for "a".

% We don't have to be boring and use single letters as variable names. In
% general, it's a VERY good idea to use descriptive names for your
% variables.
darthVader = 7;
han_solo = 4*4;
R2D2 = (han_solo + darthVader)/2;

% Note that we use underscores instead of spaces in variable names.
% Also, we can't use a hyphen, because "han-solo" would be read as "han" minus
% "solo"!

% Another neat feature of the prompt: If you type part of a variable name and
% then hit "tab", you can see possible completions. Try typing "darth" and
% then hitting tab.
a =

     7


a =

     7


a =

    41


b =

    41


c =

    42


b =

    41


c =

    42
Workspace
MATLAB uses a table to look up the variables. You can view this table in the "workspace" in your matlab editor. This is useful to you for keeping track of the variables you've assigned. You can view the contents with "who" ("whos" is similar and gives you more information)
who

% You can use a semicolon to suppress output.
% The command you run still causes changes in the workspace,
% so your variable is different next time you look at it

a = 5;
a

% You can also cause output to be shown with the "display" command:
display('a');
Your variables are:

R2D2        ans         c           han_solo
a           b           darthVader


a =

     5

a
Matrix and vector creation: basics
How to enter the matrix
a = [1 2 3] % This is a row
a = [1, 2, 3] % This is also a row, the commas are optional
a = [1; 2; 3] % This is a column: the semicolons make a new row
a = [1 2; 3 4; 5 6] % This is two columns, three rows

% How do I enter a whole range of numbers?
a = [1:10] % 1 through 10, counting by 1, as a row
a = [1:2:10] % Start at 1, count up by twos, don't go past 10
a = [10:-1:4] % Start at 10, go down by 1, don't go past 4

a = [1:3; 4:6; 7:9] % Make three rows of three each

% Transpose operator flips rows and columns
a = [1:10]'
a =

     1     2     3


a =

     1     2     3


a =

     1
     2
     3


a =

     1     2
     3     4
     5     6


a =

     1     2     3     4     5     6     7     8     9    10


a =

     1     3     5     7     9


a =

    10     9     8     7     6     5     4


a =

     1     2     3
     4     5     6
     7     8     9


a =

     1
     2
     3
     4
     5
     6
     7
     8
     9
    10
EXERCISE
Try creating different arrangements of the numbers 1 through 6. Can you create a row vector? A column vector? The row 1 2 3 above the row 4 5 6? The column 1 3 5 beside the column 2 4 6?
Vector access
Let's create a vector. A note on names: we don't have to call our variables only "a" all the time. Using descriptive names will help you later. For now, we'll call our variable "vec" so we remember that it's a vector.
vec = [101:112];

% Access elements in a vector using parentheses
vec(2) % This gives us the second element of the vector
vec(4)

% Access multiple elements at once
% Instead of just one number in the parentheses, we can put a range of numbers.
vec(3:6); % This gives us elements 3, 4, 5, and 6.

% "end" is a special keyword for accessing the last element.
vec(end)
vec(1:end)

% The colon operator alone puts everything into one column. We'll see more
% of it later to understand why it's useful.
vec(:)
ans =

   102


ans =

   104


ans =

   112


ans =

   101   102   103   104   105   106   107   108   109   110   111   112


ans =

   101
   102
   103
   104
   105
   106
   107
   108
   109
   110
   111
   112
Matrix access
Let's create a matrix to play with, and call it "mat".
mat = [1:3; 4:6; 7:9];

% We can use *two* subscripts to access elements of our matrix by
% specifying the row and the column. (Row first, then column).
mat(2,1)
mat(3,3)

% As before, each subscript can be a single number or a range of numbers
mat(2, 1:3)
mat(1:3, 2)
mat(2:end, 1);

% As before, the colon operator selects "everything": all rows and/or all columns
mat(3,:)
mat(:,:)
ans =

     4


ans =

     9


ans =

     4     5     6


ans =

     2
     5
     8


ans =

     7     8     9


ans =

     1     2     3
     4     5     6
     7     8     9
EXERCISE
Below is a matrix called "b". Write four expressions: one each to select just all the 0's, all the 1's, all the 2's, or all the 3's.
b = [2 2 2; 3 1 1; 3 1 1; 0 1 1];
Errors in matrix creation and access
Sometimes there will be an error! Thats OK! That's totally normal!
% Examples of failed vector access:
test = [1 2 3];

% test(4) % "Index exceeds matrix dimensions" because we tried to take the
%   fourth element of a 1x3 vector, and 4 exceeds 3.

% test(0) % "Subscript indices must either be real positive integers or
%   logicals." We get this error because 0 is not a positive integer. Unlike
%   in other programming languages, there is no "zeroth" element. The first
%   element is indexed with 1.

% test(-1) % "Index exceeds matrix dimensions" again. I have no idea why
%   MATLAB doesn't first warn you that -1 isn't positive.

% Examples of failed matrix creation

% test = [1:3; 4:8]; % "Error using vertcat. Dimensions of matrices
%    being concatenated are not consistent." The problem is that we are
%    trying to put [1, 2, 3] in the top row and [4, 5, 6, 7, 8] in the
%    bottom row, but the rows are not the same size so there is no way
%    to "vertically concatenate" (vertcat) row 1 onto row 2.
Functions
% Functions are calculations that have names. For example in math notation
% "y = f(x)", f is the name of the function. x is the input. y is the output.

% Some functions perform mathematical operations:
abs(-2);
sin(pi/2);
round(2.7);
ceil(2.7);
floor(2.7);

% Some functions compute other properties of their inputs:
size(vec)
size(mat)
size(4) % notice while we're here that scalars are stored in matlab as 1x1 matrices
ans =

     1    12


ans =

     3     3


ans =

     1     1
Getting help
MATLAB contains extensive documentation, which you can access using the "help" command to view it in the command window, or the "doc" command to pull up a pretty window.
help size
doc size

which vec
which abs
 SIZE   Size of array.
    D = SIZE(X), for M-by-N matrix X, returns the two-element row vector
    D = [M,N] containing the number of rows and columns in the matrix.
    For N-D arrays, SIZE(X) returns a 1-by-N vector of dimension lengths.
    Trailing singleton dimensions are ignored.

    [M,N] = SIZE(X) for matrix X, returns the number of rows and columns in
    X as separate output variables.

    [M1,M2,M3,...,MN] = SIZE(X) for N>1 returns the sizes of the first N
    dimensions of the array X.  If the number of output arguments N does
    not equal NDIMS(X), then for:

    N > NDIMS(X), SIZE returns ones in the "extra" variables, i.e., outputs
                  NDIMS(X)+1 through N.
    N < NDIMS(X), MN contains the product of the sizes of dimensions N
                  through NDIMS(X).

    M = SIZE(X,DIM) returns the length of the dimension specified
    by the scalar DIM.  For example, SIZE(X,1) returns the number
    of rows. If DIM > NDIMS(X), M will be 1.

    When SIZE is applied to a Java array, the number of rows
    returned is the length of the Java array and the number of columns
    is always 1.  When SIZE is applied to a Java array of arrays, the
    result describes only the top level array in the array of arrays.

    Example:
    If
       X = rand(2,3,4);
    then
       d = size(X)              returns  d = [2 3 4]
       [m1,m2,m3,m4] = size(X)  returns  m1 = 2, m2 = 3, m3 = 4, m4 = 1
       [m,n] = size(X)          returns  m = 2, n = 12
       m2 = size(X,2)           returns  m2 = 3

    See also LENGTH, NDIMS, NUMEL.

    Overloaded methods:
       table/size
       categorical/size
       timer/size
       serial/size
       triangulation/size
       TriRep/size
       dataset/size
       tscollection/size

    Reference page in Help browser
       doc size

vec is a variable.
built-in (/mnt/storage/Matlab/duke-matlab-linux-location/toolbox/matlab/elfun/@double/abs)  % double method
An important aside about notation
Watch out, there are two totally identical-looking parenthesis notations And they're totally different!
vec(3) % 1) accessing a vector/matrix element
abs(3) % 2) calling a function

% MATLAB will let you override built-in functions. Avoid this!
abs = [10, 11, 12];
abs(3)

which abs % Abs is now a variable??
% Yep,'abs' is in the list of variables! MATLAB looks there first
% In fact *every time* you type something, MATLAB has to look it up

% To remove a variable from the lookup table, use "clear":
clear abs
which abs
ans =

   103


ans =

     3


ans =

    12

abs is a variable.
built-in (/mnt/storage/Matlab/duke-matlab-linux-location/toolbox/matlab/elfun/@double/abs)  % double method
Matrix/vector creation: using functions
a = zeros(2, 3) % Create a matrix of all zeros, with 2 rows and 3 columns
a = ones(3) % Oops, this might seem like like "three ones", but it's actually 3x3!
a = ones(3,1) % We need to explicitly say "3 rows, 1 column"
a = ones(1,3) % or "1 row, 3 columns"

a = eye(3) % Identity matrix

a = rand(3, 3) % Uniform distribution
a = randn(3, 3) % Normal distribution
a = randi(10, 3, 3) % Integers up to 10

diag(a) % Extract the elements along the diagonal
triu(a) % Keep just the upper triangle, zero out the lower triangled(
a =

     0     0     0
     0     0     0


a =

     1     1     1
     1     1     1
     1     1     1


a =

     1
     1
     1


a =

     1     1     1


a =

     1     0     0
     0     1     0
     0     0     1


a =

    0.8147    0.9134    0.2785
    0.9058    0.6324    0.5469
    0.1270    0.0975    0.9575


a =

    2.7694    0.7254   -0.2050
   -1.3499   -0.0631   -0.1241
    3.0349    0.7147    1.4897


a =

     8     1     7
    10     9     8
     7    10     8


ans =

     8
     9
     8


ans =

     8     1     7
     0     9     8
     0     0     8
Concatenating matrices
Larger matrices can be built out of smaller matrices by concatenating them together. When concatenating matrices, their sizes have to line up.
c = [1:4]; % 1x4: 1 row and 4 columns
d = [11:14]; % another 1x4 matrix

% Horizontal concatenation:
% To stack beside each other, use a comma (like making a row vector!)
[c, d]

% Vertical concatenation:
% To stack on top of each other, use a semicolon (like making a column vector!)
[c; d]

% Concatenation requires sizes to match:
e = [101:104; 105:108]; % 2x4

% [d, e] % These won't stack beside each other because they have different numbers of rows
[d; e] % But one row stacks on top of two rows just fine!
ans =

     1     2     3     4    11    12    13    14


ans =

     1     2     3     4
    11    12    13    14


ans =

    11    12    13    14
   101   102   103   104
   105   106   107   108
Vector math
Let's try some simple vector math: +, -, / (abs, floor, sin, sort)
% Set up variables to play with:
a = 4;
x = [1:5];
y = [11:15];
z = rand(1,7);

% Vector multiplied by a scalar
a*x
% Vector addition and subtraction (elementwise)
x + y
x - y

% Note that x + z fails, due to wrong sizes
ans =

     4     8    12    16    20


ans =

    12    14    16    18    20


ans =

   -10   -10   -10   -10   -10
Inner product
inner_product = x * y why didn't the above work? we can look in the workspace window, or use size to figure out our variable sizes
inner_product = x * y'

% The inner product (dot product) sums the products of the elements.
% Both of the following are the same as the inner product:
x(1)*y(1) + x(2)*y(2) + x(3)*y(3) + x(4)*y(4) + x(5)*y(5)
sum(x.*y)

% inner product of perpendicular vectors is 0
[2 2] * [-5 5]'
inner_product =

   205


ans =

   205


ans =

   205


ans =

     0
Outer product
The outer product (Cartesian product) expands two vectors into a matrix of their elementwise products
outer_product = x' * y
outer_product =

    11    12    13    14    15
    22    24    26    28    30
    33    36    39    42    45
    44    48    52    56    60
    55    60    65    70    75
Element-wise operations
.* operator ("Dot-times")
x.*y

% ./ operator
y./x
ans =

    11    24    39    56    75


ans =

   11.0000    6.0000    4.3333    3.5000    3.0000
Summary statistics
min, max, mean, std
% Vectors:
sum(x);
min(x);
max(x);
mean(x);
std(x);

% Matrices:
sum(mat) % Sum over rows. How do we sum over columns? Ask "help sum"
sum(mat,2) % Sum over the second dimension

% How to get the sum of ALL the values in the matrix?  There are several ways of
% coding this
sum(mat(1:end))
sum(mat(:));
sum(sum(mat));

% Average of our matrix
% average(mat) % hm, this function doesn't exist? Let's look at the help:
which average; % not found! interesting
lookfor average; % search the help docs for the word "average"
% oh, we wanted "mean", right.

mean(mat)
mean(mat, 1)
mean(mat, 2)
ans =

    12    15    18


ans =

     6
    15
    24


ans =

    45

'average' not found.
vis_averagefailure             - Generate bar plot of model failure (predicted minus
mean                           - Average or mean value.
mean2                          - Average or mean of matrix elements.
ewmaplot                       - Exponentially weighted moving average chart.

ans =

     4     5     6


ans =

     4     5     6


ans =

     2
     5
     8
Plotting
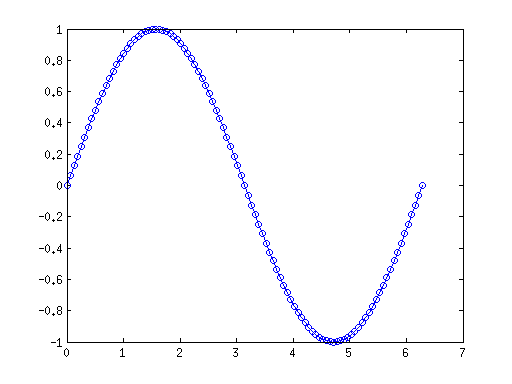
% You can't just "plot a function" directly: first you have to define a
% discrete set of x values, then compute the corresponding y values, then
% plot the x points against the y points

% Let's define 10 points, and plot the "sin" function at those points:
x=[0:1:10];
y=sin(x);
plot(x,y)
plot(x,y,'o')
plot(x,y,'o-')
% (The above "plot" commands will overwrite each other in the figure window,
% so run each one separately if you want to see their separate output.)

% That image is too choppy. Let's try using more x values.
x = [0:(2*pi/100):(2*pi)]; % (Remind yourself how the colon notation works here)
y = sin(x);
plot(x,y,'o-');

% That was actually 101 points. What if we want 100 points?
x = [0:(2*pi/99):(2*pi)]; % way 1 - this is unreadable, don't do this
x = linspace(0,2*pi,100); % way 2 - this is readable!
Plotting multiple lines on the same axis
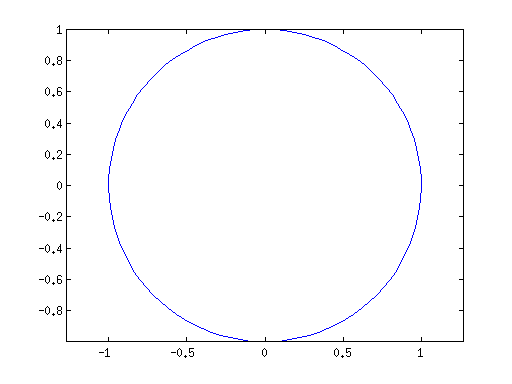
y = sin(x);
z = cos(x);
plot(x,y,x,z);

% Plot without specifying your x values, it assumes 1:n
plot(y);

% Treat x like a parametric variable
plot(y,z); axis equal
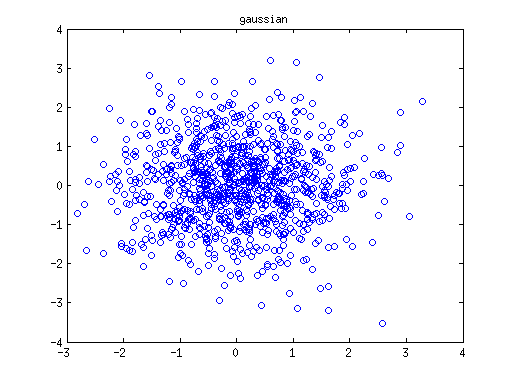
More visualizations: histograms and scatterplots
plot(rand(1,100))
hist(rand(1,100))
hist(rand(1,1000))
hist(rand(1,1000000))

plot(rand(1,1000), rand(1,1000), 'o')
title('uniform')

plot(randn(1,100))
hist(randn(1,100))
hist(randn(1,1000))
hist(randn(1,10000))
hist(randn(1,100000),-4:0.1:4)

plot(randn(1,1000), randn(1,1000), 'o')
title('gaussian')
Scripts
A script is a file that ends in ".m" which contains MATLAB code that's meant to be run all together.
Why write a script? 1) Save your work! 2) Run whole blocks of code at a time without typing it out at the prompt
(TA will create a script now and show how it works in a workspace) The TA's script will demonstrate more plotting features: ylim, xlim axis( [0,3] , [0,3] ) xlabel, ylabel title hold on
Ways to use a script:
1. Use the green "RUN" button to run it all. This works just like typing it all at the prompt
2. Use ctrl-enter or apple-enter to run just one subsection at a time (subsections are separated by a double-percent "%%" at the start of the section)
3. Highlight a piece of the code and hit F9 to run just that portion