Assume we have an electrode either in the ganglion cell layer of the retina or in the optic nerve. The response of the ganglion cell will depend upon the responses of the cells that feed into the ganglion cell, including the photoreceptors, the bipolar cells and the various lateral interconnections via horizontal cells and amacrine cells. However, what we are really interested in is the relationship between this ganglion cell's activity (firing rate) and the visual stimulus image.
H.K. Hartline of Rockefeller University in New York did the first important experiments on this, working in the limulus (horseshoe crab). Later Stephen Kuffler at Harvard University, and Horace Barlow at Cambridge University in England also did some of the pioneering work on this topic in the early 1950s, working on the visual systems of both frogs and cats. They analyzed the ganglion cells' sensitivity to light by using the following simple technique. A very small spot of light was flashed on the surface of the retina for a brief duration. The position of the spot of light was systematically varied across the retinal surface, and while they did this the response of the ganglion cell was continuously monitored.
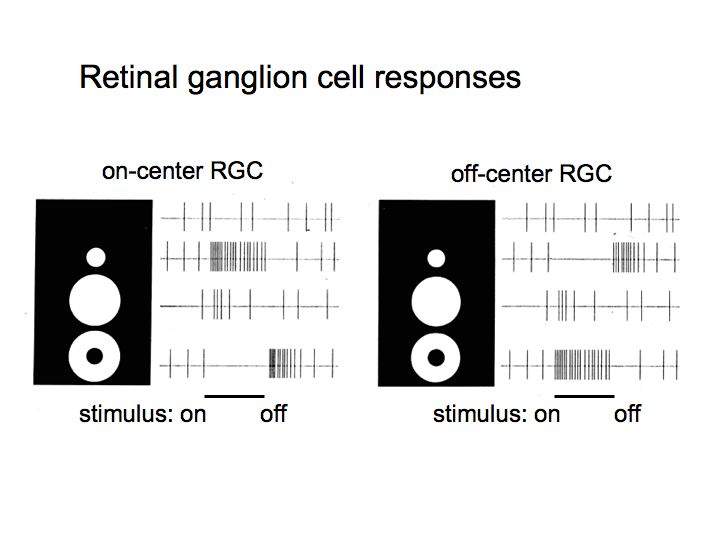
The icons on the left represent the various visual stimuli. Next to that is the signal recorded by the electrode for each stimulus. Spontaneous firing rate of a few spikes/sec were measured when no stimulus was presented. For most positions on the surface of the retina, flashing a spot of light has absolutely no effect on the cell's response (that is, it continues responding at its spontaneous firing rate). Within a particular region, called the receptive field, flashing the spot affects the ganglion cell's response. You can think of the receptive field as either:
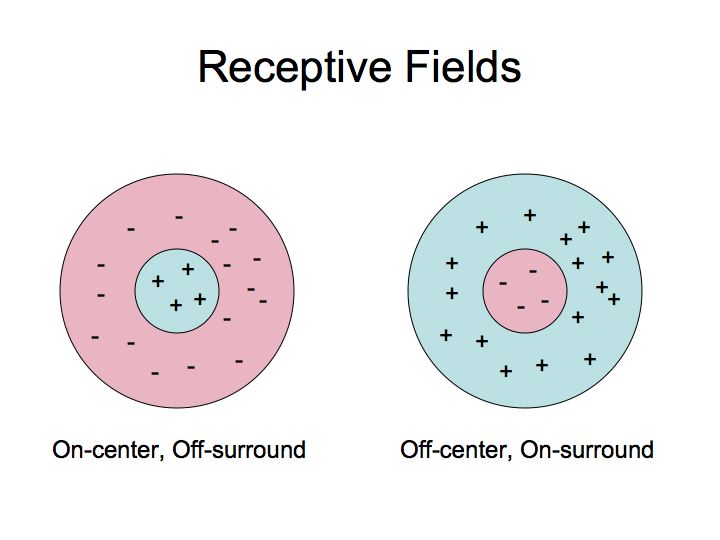
Receptive field subregions: The area within the receptive field is subdivided into two regions, center and surround. There are two primary types of ganglion cell receptive fields:
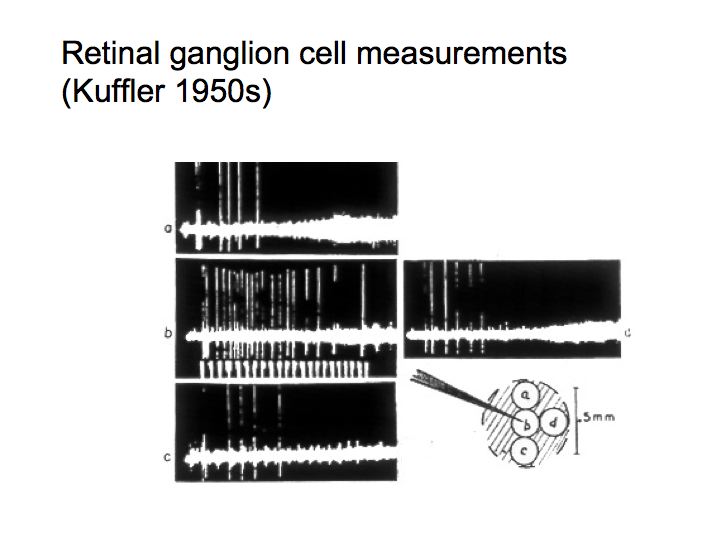
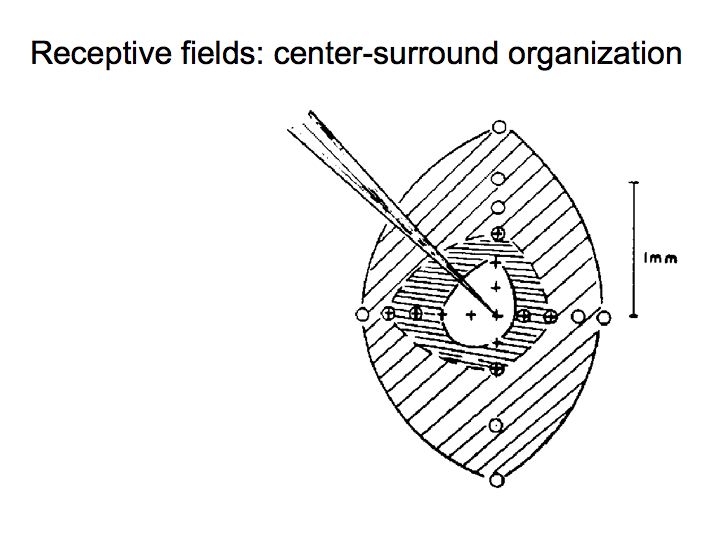
The figure above shows some of Kuffler's early measurements of ganglion cell physiology from which he inferred the center-surround structure of retinal ganglion cell receptive fields (as he drew in the figure above).
Receptive field movie (17 Mb QuickTime movie)
In class we showed a video that demonstrates the responses of ON- and OFF-center cells. The video shows the visual stimuli that were presented while recording from each of several neurons. The electrode was connected to an amplifier, and output to a loudspeaker. The audio track allows you to hear the loudspeaker - each click corresponds to an action potential. We showed examples of an ON-center receptive field that responded at the onset of a small bright light centered in the right position and and OFF-center receptive field that responded at the offset of a small bright light. The ON-center cell also responded at the offset of an annulus of light and the OFF-center cell responded at th onset of the annulus of light. Neither responded well to an overall change in brightness covering a large area. A small spot of light or narrow annulus of light was needed.
Note that ON- and OFF-center ganglion cells with superimposed receptive fields give complementary responses. When the ON-center cell responds strongly, the OFF-center cell is quiet and vice versa.
Note that the combination of ON-center and OFF-center ganglion cells is another example of a parallel pathway. They are physiologically distinct (as just described above). They are anatomically distinct: the dendrites branch out in separate sub-layers of the retina and they receive synaptic inputs from different subclasses of bipolar cells. There is complete coverage: ON-center and OFF-center receptive fields each completely cover the visual field. The neural signals originating in the ON- and OFF-center retinal ganglion cells remain segregated in the retina and the LGN, then merge completely in the complex cells in primary visual cortex (V1).
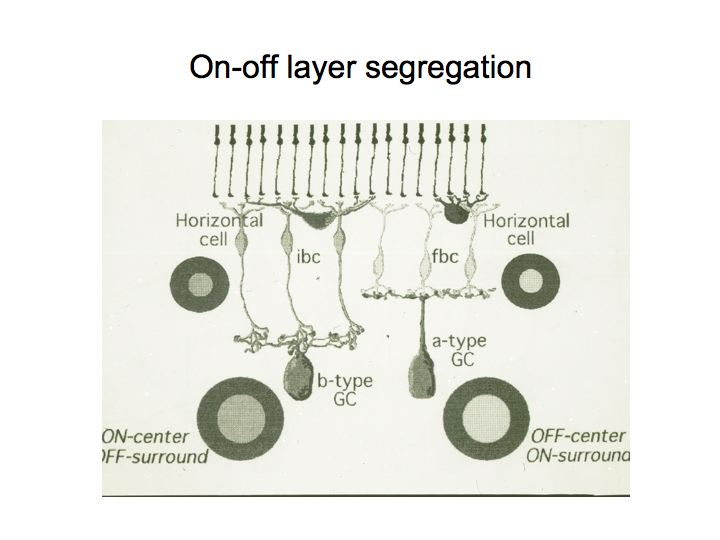
The figure above shows the circuitry in the retina for the ON- and OFF-center cells. Note that the dendrites of the a-type (OFF-center) and b-type (ON-center) ganglion cells extend to different layers of the retina where they receive synapses from different kinds of bipolar cells (labeled ibc and fbc).
The notion of a receptive field is a central one in all of visual neuroscience. We will see many examples of different kinds of receptive fields - not all visual neurons have this simple center-surround arrangement to their receptive fields.
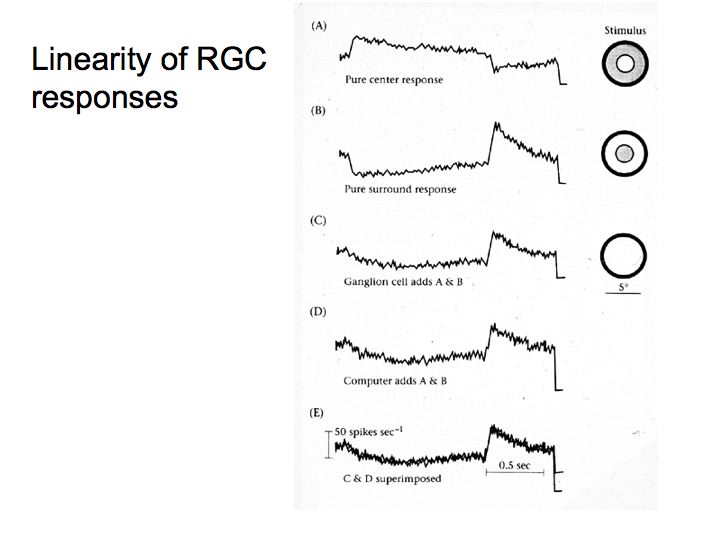
These are data from experiments by Christina Enroth-Cugell. They show that the response to the center stimulus alone plus the response to the surround stimulus alone equals the response to simultaneous stimulation of center+surround. That is, this ganglion cell obeys the additivity rule. The figure doesn't show tests of the scalar rule and shift-invariance. The scalar rule holds up as well, and shift-invariance holds because ganglion cells give pretty much the same response when stimulated with the same visual stimulus again later in time. In addition, ganglion cells are shift invariant in the sense that there are ganglion cells with similar receptive fields located at other retinal positions.
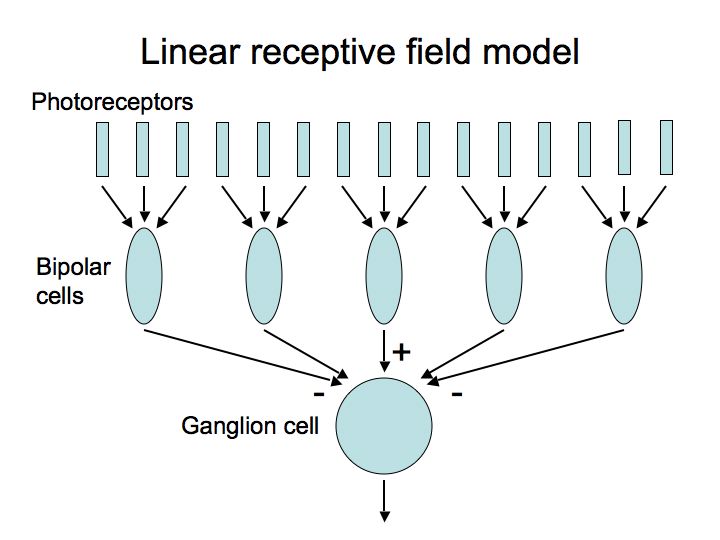
The ganglion cell response is a weighted sum of stimulus intensities, with positive weights in ON subregions, and negative weights in OFF subregions.
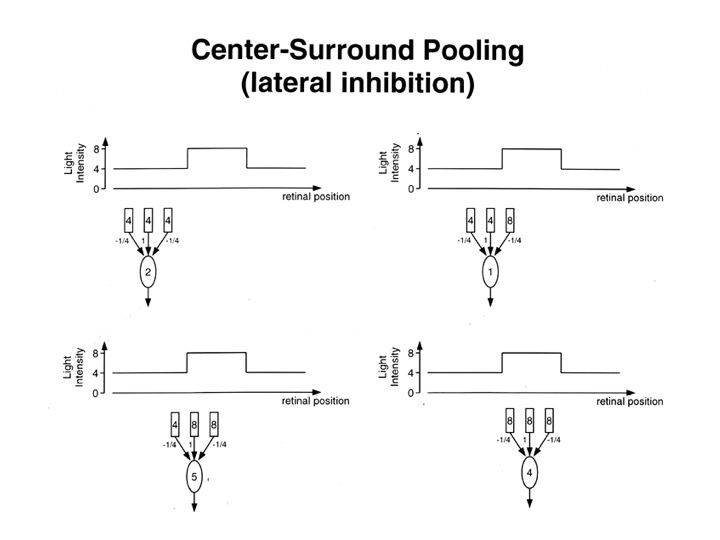
Thus, we add the light intensities at each point weighted by positive and negative weights corresponding to the center and surround subregions of the receptive field. Example: at the top-left: (-1/4)(4) + (1)(4) + (-1/4)(4) = 2.
The result is a pattern of activity across the spatial array of ganglion cells. John Robson coined the term neural image to refer to the distribution across the retina of ganglion cell (or other neural) responses. Since ganglion cells are linear systems, we can predict their responses to any visual stimulus.

This graph at the bottom shows a neural image of retinal ganglion cell responses at each position in the retina for the stimulus (dark, bright, dark) above. Can you figure out why the neural image has the little wiggles overshooting the flat parts? Hint: look back at the previous figure where we see how the ganglion cell adds light intensities with a center-surround weighting.
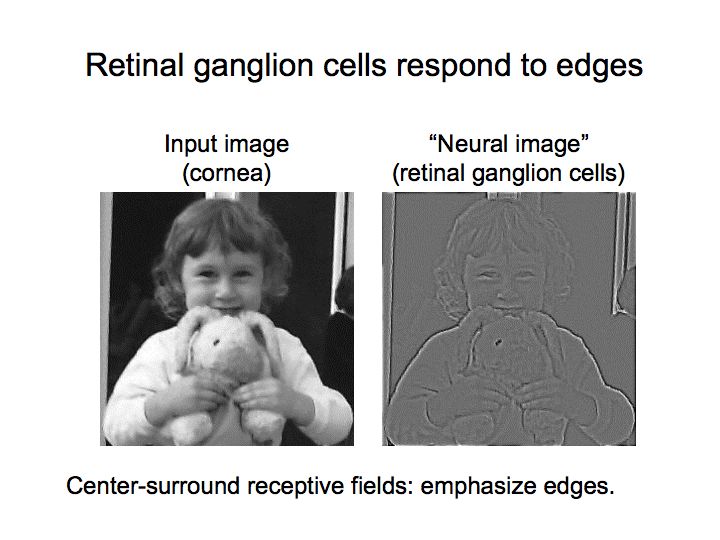
This figure shows a computer simulation of the retinal ganglion cell neural image in response to Prof. Heeger's daughter and her bunny. The image on the left is the input stimulus presented to the eye. The image on the right is a simulation of the retinal ganglion cell responses. The intensity at each position is proportional to the response of a retinal ganglion cell with a receptive field centered at that position. Mid-gray means no response. White means a large response by the ON-center ganglion cells. Black means a large response by the OFF-center cells. What's the point of center-surround receptive fields? They emphasize edges.