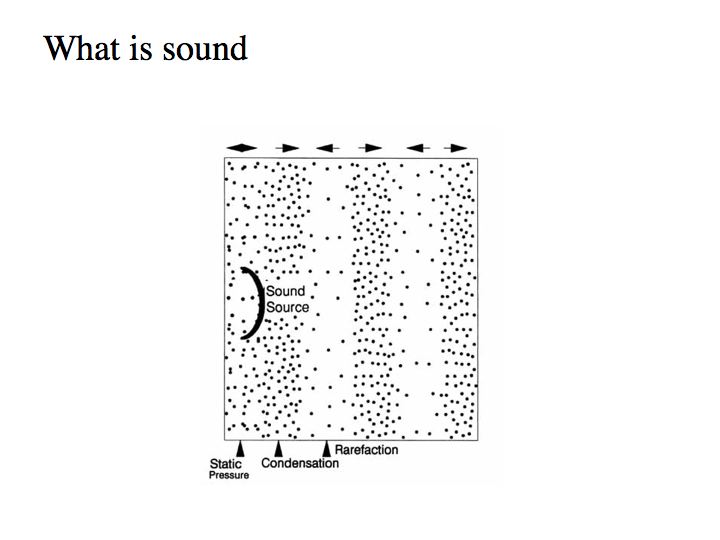
Illustration of expansion and condensation of air
What is it that we hear when I clap my hands? Obviously it is nothing about the hands themselves, since they are very far from your ears. There must be some carrier, some physical process, that conducts energy from my hands to your ears. When my hands rush together to clap, they force the air that was between them to evacuate the space it was in. Air that was at the location now filled by my hands must have gone somewhere. The motion of my hands caused the air at this location to push the air molecules in the surrounding region, temporarily creating a region of high air pressure right around my hands. This is an inherently unstable situation because there is nothing preventing the air in the high pressure region from moving toward a lower pressure region. So, the high pressure region around my hands pushes its way outward, again, to the surrounding air molecules.
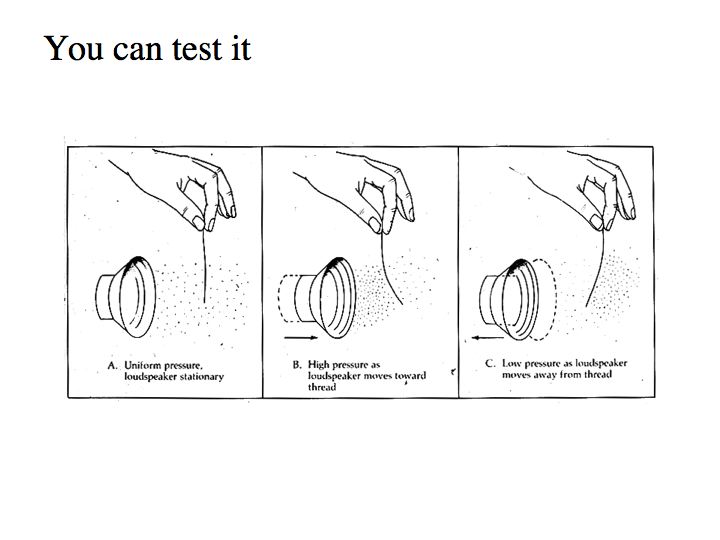
Thread in front of speaker slide
Acoustic stimuli are communicated through the change of air pressure. You can see this yourself on a stereo system by turning up the volume and putting a light object, such as a thread, in front of the speaker. You will see the thread wave back and forth in response to the changing sound pressure caused by the speaker.
Sound pressure with distance
How does the acoustic wave depend upon your distance from the event? The tendency of the high pressure region to invade the region surrounding it means that it will have to invade increasingly large regions of space - the sphere that is just around my hands is fairly small, but the sphere that surrounds the sphere just around my hands is somewhat larger, and the sphere that surrounds that one is larger still. But we have only displaced a fixed, finite amount of air molecules. As the sphere size grows the effect of this set of air molecules will have to be spread out over larger and larger amounts of space. In particular, the area of a sphere is equal to 4 π r2, where r is the radius of the sphere.
That means that the space filled by the outward rushing air molecules is increasing as the square of the distance from my hands, (the distance from my hands is the same as the radius of the sphere.) It follows that the change in the air pressure due to my handclap must decrease proportionately to the square of the distance from my hands. That is why sounds that are closer appear louder.
Illustration of traveling wave
Now consider what this looks like not from the point of view of the source, my hands, but instead from the point of view of your ear. For the first few moments following my hand-clap, the air molecules at your ears are undisturbed, and therefore you hear nothing. But then, when the change in air pressure which is rushing outwards in all directions, reaches the point where you are sitting, there is a momentary change in the air pressure in your ear. Then, all returns to normal. This brief disturbance of the air pressure near your ear is the only information available to you about the hand clap.
Complex sound signal
Real sound signals (speech, music, etc.) can involve very complex changes in sound pressure level over time. We need to get a handle on how to better characterize sound signals themselves before moving on to how the ear responds to sound.
Pure tones

A pure tone is what you get from a tuning fork. High frequency pure tones sound like high pitches and low frequency pure tones sound like low pitches. A pure tone is characterized by two numbers: frequency and amplitude.

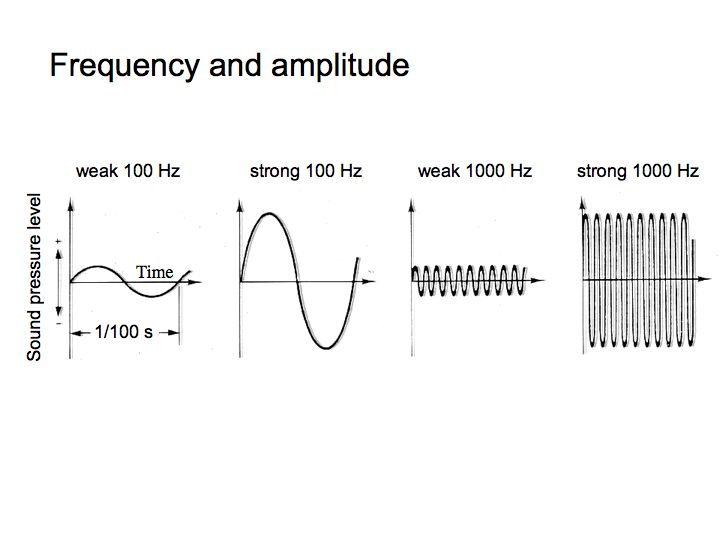
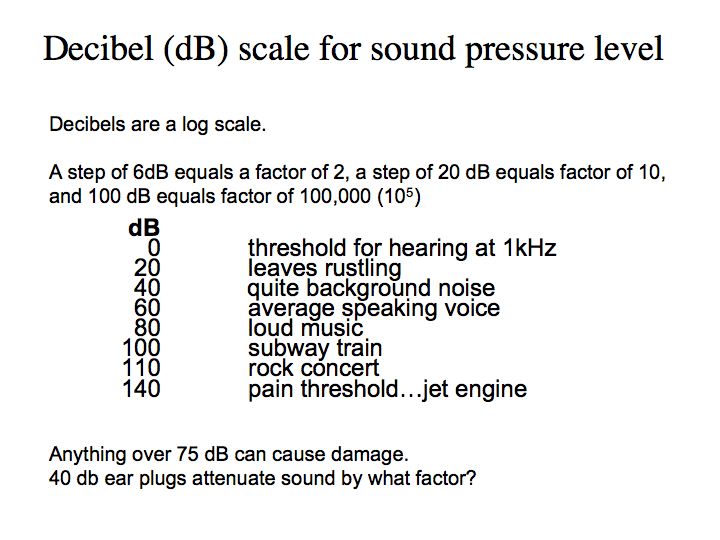
A high frequency pure tone is perceived to have a high pitch. Frequency is expressed in units of Hertz (Hz), which is the number of cycles of sound pressure change per second. 1 Hz = 1 cycle/sec or a temporal period of 1 sec. 10 Hz = 10 cycles/sec or a temporal period of 1/10 sec. A high amplitude pure tone is perceived to be lound. Sound pressure levels are typically measured in decibels (dB). Decibels are a log scale. A step of 20 dB equals a factor of 10, and 100 dB equals factor of 100,000 (a big range).
Hearing sensitivity to different frequencies
When you go to the ear doctor to have your hearing test, you are asked to perform a detection experiment with pure tones. For each pure tone frequency, the doctor determines the sound pressure level that is just barely detectable.
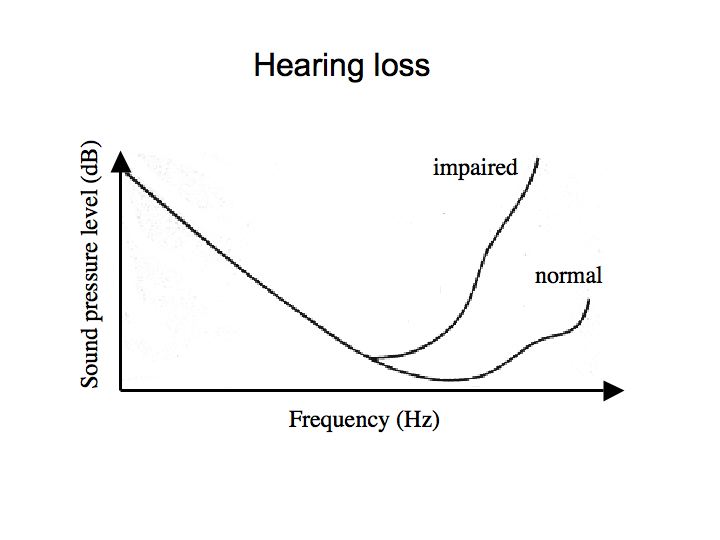
Examples are shown in the graph (which plots threshold sound pressure level vs frequency) for someone with normal hearing and for someone with hearing loss like that which happens typically with age. Notice that for very low frequencies (on the left) and very high frequencies (on the right), the pure tone must have a very high amplitude to be heard. In other words, we usually do no hear very high or very low frequencies unless they are very high in amplitude.
There are other technologies that also take advantage of differences in hearing thresholds. Some companies have, for example, developed devices to make sounds that many adults cannot hear. An New York Times article about these devices appeared on June 12, 2006.
Frequency decomposition
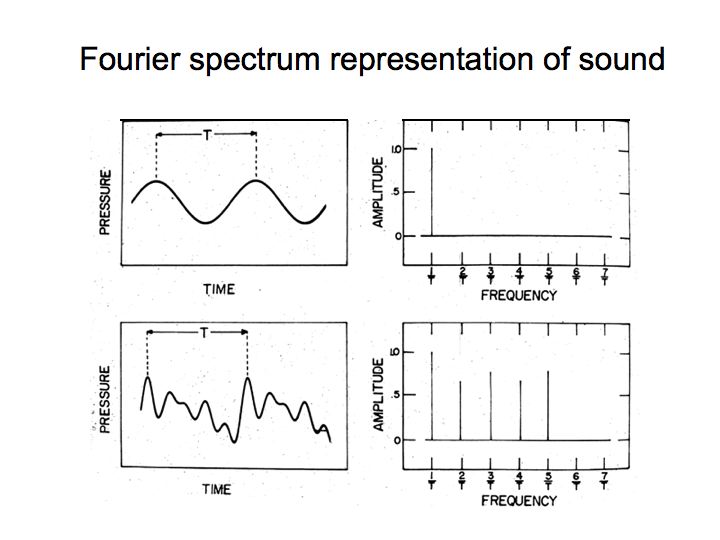
Sound signals and their Fourier spectra
Sound signals are often characterized in two different ways. The graphs on the left plot sound pressure level (SPL) as it varies, increasing and decreasing, over time. The graphs in the right are called the Fourier spectra of the sounds, and they plot sound pressure level versus frequency. It is a cool fact that any sound signal can be decomposed as a sum of pure tones or frequency components. The Fourier spectrum graph plots the intensities (sound pressure levels) of the separate pure tones that make up (when summed together) the entire sound signal.
You are already familiar with the frequency decomposition of sounds. For example, the controls on a stereo are designed around the Fourier frequency decomposition. Adjusting the bass alters the level of the low frequency signals, while adjusting the treble alters the level of the high frequency signals. Equalizers divide up the signal into many frequencies and give you finer control.
Swinging pendulum demo
Swinging pendula act as frequency analyzers informing us about the motion of my hand. When the short pendulum swings a lot you can draw the inference that there is considerable high frequency, or rapid, alternation back and forth of the stick. When the long pendulum swings a lot you can draw the inference that there is considerable low frequency, or slow oscillation back and forth of my hand. Imagine a stick with many pendula on it of all different lengths. Moving the stick in some particular way (e.g., slow back and forth) would lead to a particular combination of motions of the pendula (e.g., long ones only swing). The Fourier spectrum is essentially a plot showing the amplitudes of swing for each of the pendula.

Here's an example of a more complicated sound that is made up of three frequency components. The top-left graph plots sound pressure level over time. The top-right graph is the Fourier spectrum (amplitude versus frequency). The bottom panel shows how the three pure tones add up to give the full sound signal.
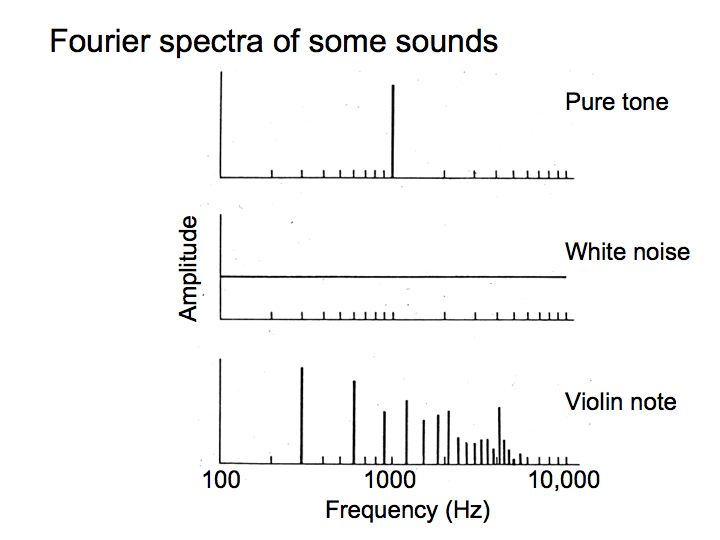
Real sounds that are produced natually (e.g., by your vocal cords or by a musical instrument) typically have a fundamental frequency and harmonics (multiples of the fundamental). [Add more here]
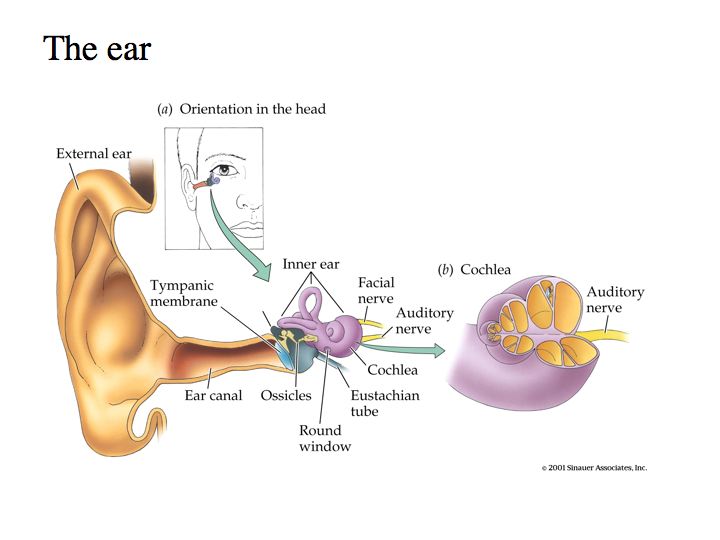
The pinna is the large bit of skin on the side of your head that focusses sound waves into your auditory canal. The tympanic membrane or ear drum is a cone-shaped membrane, about 69 sq mm. Sound wave propagates through the auditory canal and introduces a differential between the air pressure levels on the two sides of the tympanic membrane. This differential causes the ear drum to move. The internal pressure on one side of the tympanic membrane acts as a baseline estimate of the general, atmospheric pressure. We must re-adjust this level occasionally when we are subjected to changes in the ambient air pressure (e.g., in an airplane or scuba diving).
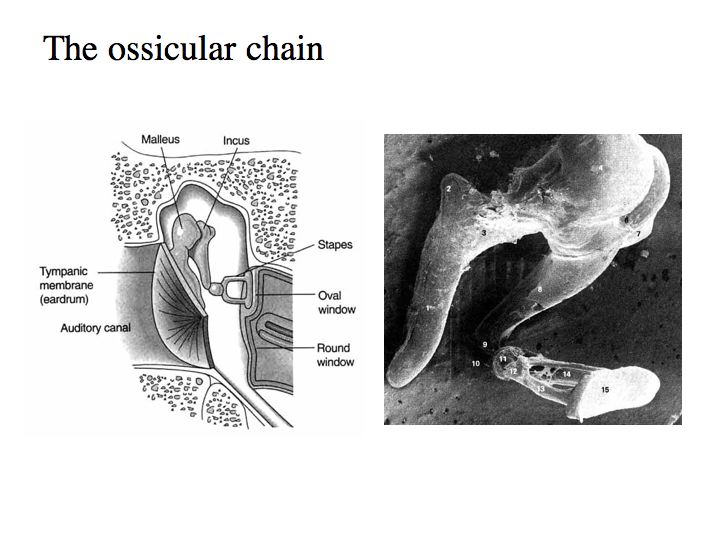
Displacing the tympanic membrane causes tiny bones, the ossicular chain, to move. The malleus or hammer (on the left in the EM picture) is attached to the tympanic membrane. The incus or anvil (in the middle) acts as fulcrum. The stapes or stirrup (on the right) is attached to the inner ear at the oval window.
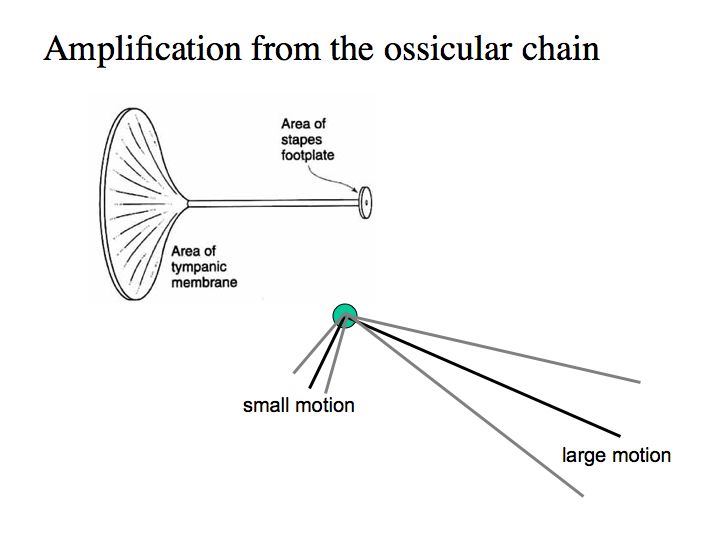
The ossicular chain acts as an amplifier: the pressure per unit area applied by the stapedial footplate to the oval window is about 14 times as great as the pressure per unit area applied to the ear drum by the external changes in air pressure. This increase in pressure per unit area is important because the opposite side of the oval window is filled with liquid that is harder to compress or move than air. Amplification is accomplished by two factors: (1) the area of the tympanic membrane is about 10x greater than that of oval window, (2) the fulcrum-like action of the ossicular chain. The ossicular chain is suspended in the middle ear by several tendons. When the tympanic membrane moves, the bones pivot about the anvil. Because of the position of the pivot point, a small motion of the membrane leads to a larger motion of the oval window.
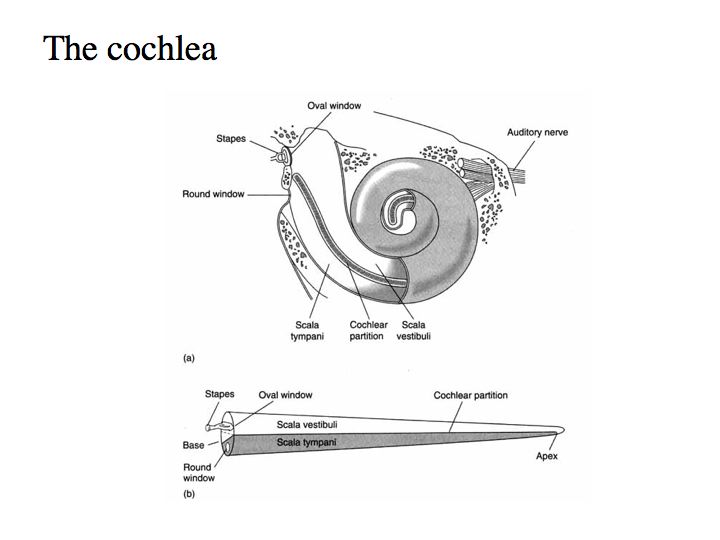
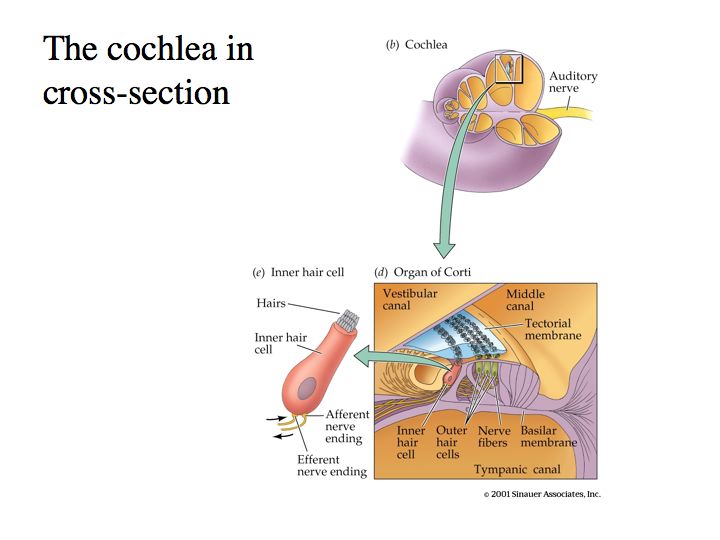
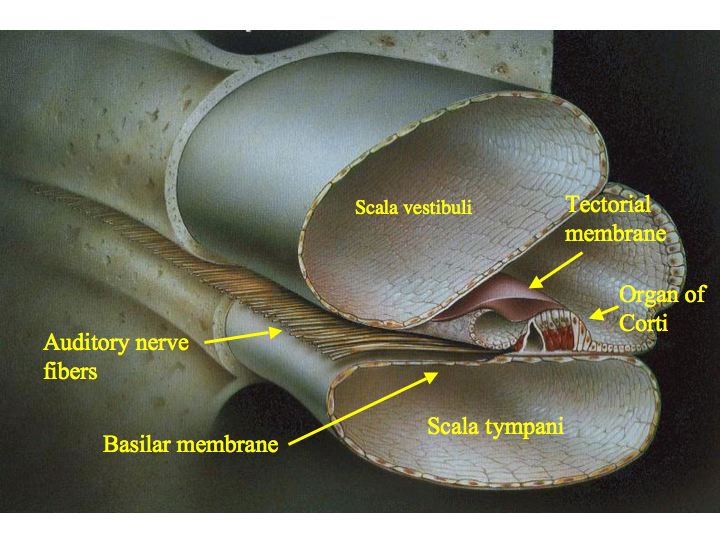
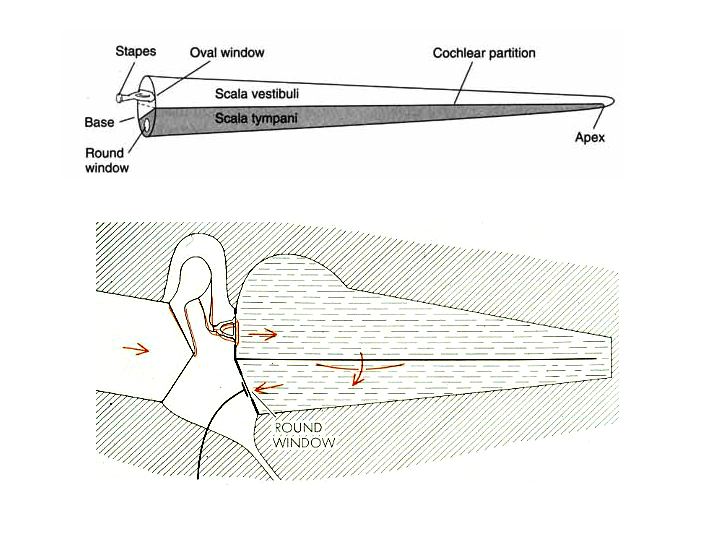
The cochlea divided into three regions called: the scala vestibuli, scala media, and scala tympani.
When the ossicular chain presses against the oval window, it gives the fluid in the cochlea a good push. This causes a local change in fluid density which propagates through the scala vestibuli, around the outside of the scala media to the end of the cochlea. At the end of the scala vestibuli, there is a small opening that connects up the two outer scala. The opening is called the helicotrema. The energy in the fluid is largely dissipated by the time it reaches the helicotrema. Whatever's left is dissipated by elasticity of the round window. The crucial region is the scala media, that moves up and down as the fluid pressure waves propagate by.
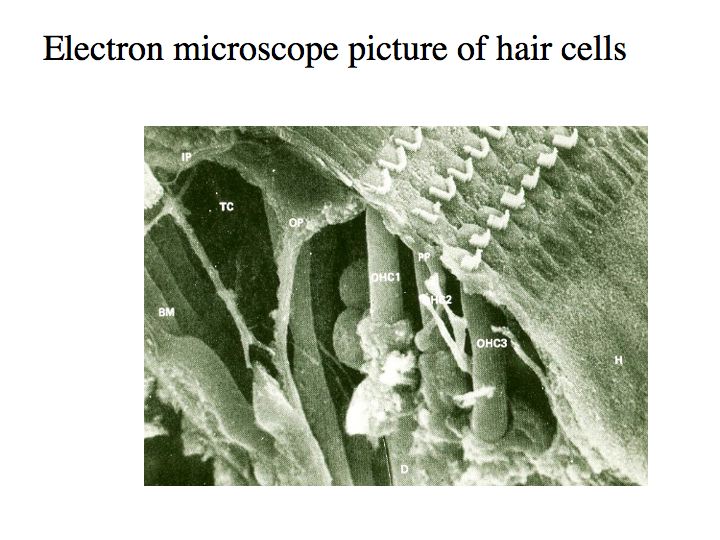
Schematic showing Arches of corti
The arches of corti are a complicated set of structures sitting on the basilar membrane. The main parts we're interested in are:
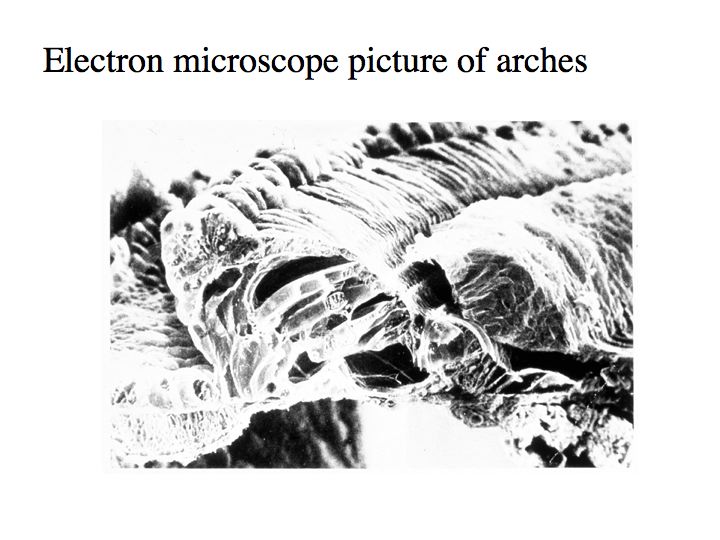
The arches really do look like arches.
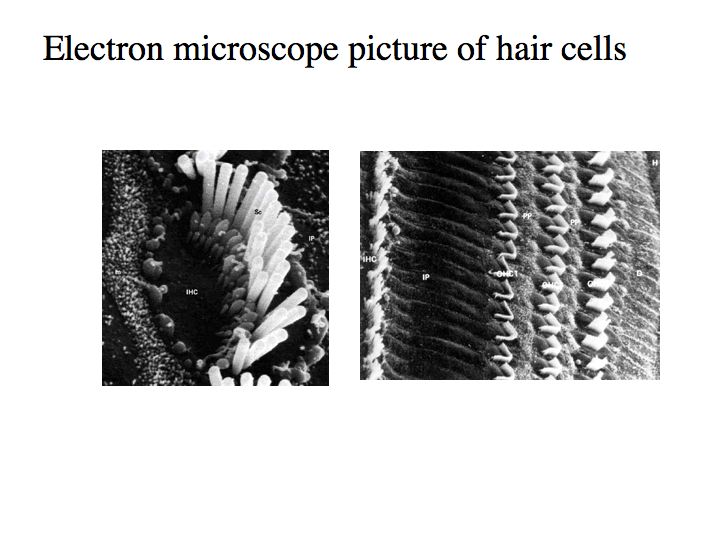
This is an electon microscrope picture from the point of view of the tectorial membrane, with that membrane removed. Inner and outer hair cells are easily identifiable from their position and from the characteristic shapes of the cilia. Outer hair cells' cilia form a W shape and are arranged in three rows. The inner hair cells have a more punctate cilia pattern and are arranged in a single row.
Motion of the basilar membrane
What happens to all these structures when a sound pressure waveform arrives at your ear? Air pushes the ear drum, which in turn pushes the ossicular chain, which in turn presses against the oval window. That introduces a pressure difference between the fluid in the scala vestibuli (on top) and the scala tympani (at the bottom), with the elastic basilar membrane in between. The pressure difference pushes the basilar membrane down. A little while later, when the air pressure subsides, the tympanic membrane moves out pulling the oval window with it. Now the pressure difference is in the opposite direction and the basilar membrane moves up. The details of these motions and their importance in hearing were properly worked out by Georg von Békésy (pronounced ``Bekeshy'' with emphasis on first syllable), a scientist who spent most of his career at Harvard. He won the Nobel prize (in 1961) for this work.
Motion of the arches
The arches are connected on one side to the edge of the basilar membrane, and on the other side they are connected to the center of the basilar membrane. The side connected to the center moves up and down with the basilar membrane, but the other side doesn't move much. So the arch tilts over a bit. And as the arch tilts over, the hair cells are bent back and forth. This is the key motion that converts the mechanical motions into an electrical signal used by the rest of the nervous system.
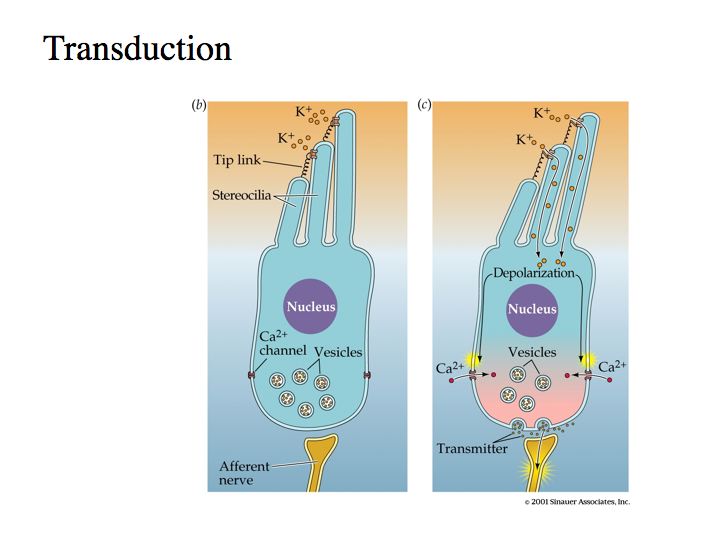
Diagram of bending and flow of potassium
Conversion from mechanical (motion of basilar membrane) energy into neural (electrical) responses in hair cells is called transduction. As the stereocilia are bent, (positively charged) potassium ions flow into the neuron. This is the electrical signal that initiates neural conduction. This voltage is graded, an analog signal. Hair cells do not fire action potentials. The hair cells themselves are attached to a bundle of nerve fibers. If the voltage signal in a hair cell is large enough, then it will cause an auditory nerve fiber to fire an action potential.
Hudspeth micro-manipulator
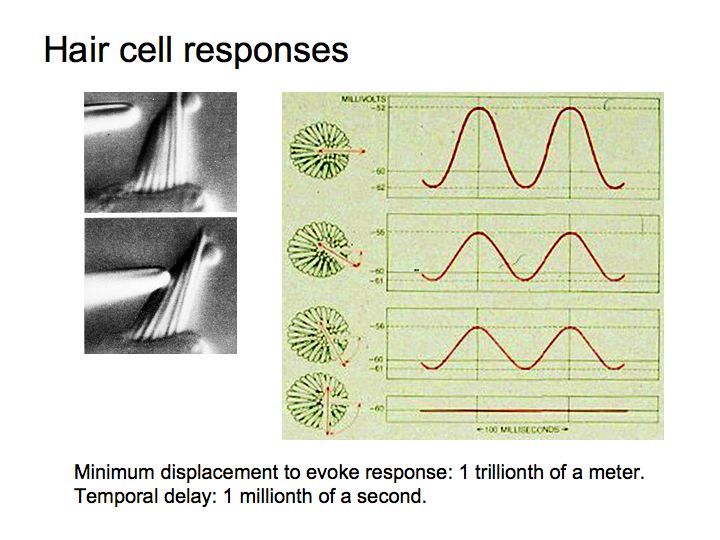
How far do the stereocilia have to move before they create a measurable electrical signal? In recent years, Jim Hudspeth has managed to stimulate the hair cells directly by use of a micromanipulator. He simultaneously displaced the stereocilia, as shown in the slide, and measured the electrical voltage in the hair cell. Hudspeth measured the size of the change in electrical signal as a function of the size of the displacement, and reported that in the bullfrog 1 trillionth of a meter was enough to evoke a measurable response. And the temporal delay is only 1 millionth of a second.
Over a large fraction of its range, the response of the hair cell is quite linear (double the displacement = double the response).
In addition, the direction of bending matters a lot. The system is designed so that, under normal circumstances, a sound signal will cause the stereocilia to bend in a certain direction. Hudspeth measured what happens when the stereocilia are bent in the other directions and he found that bending in the proper direction excites the neurons most. In fact, one can predict the strength of the response simply by measuring the displacement in the one relevant direction. The displacement in the perpendicular direction is completely irrelevant.
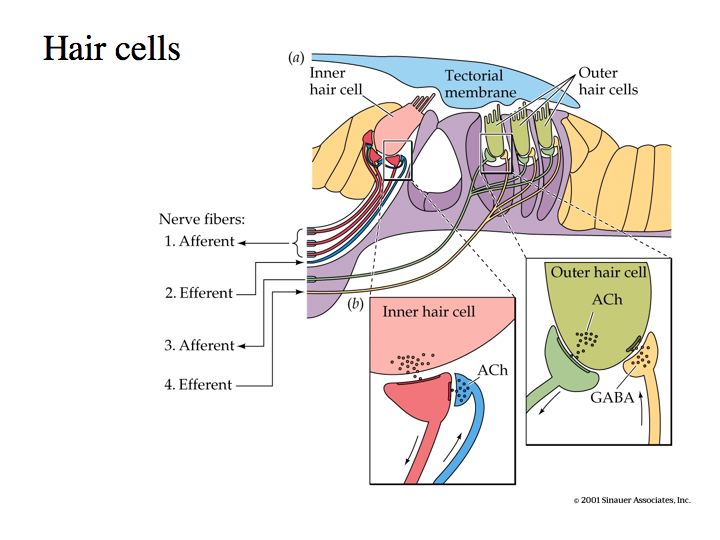
Although there are more outer than inner hair cells, most of the ascending nerves from the VIIIth cranial nerve, the auditory nerve, receive their input from the inner hair cells. These inner hair cells are responsible for capturing what we hear and communicating sound to our brain. The outer hair cells change their shape and rigidity to control the motion of the basilar membrane, amplifying weak sounds and attenuating loud sounds.
"The world's most unusual rock video" (Radio Times, August 13, 1987). You all know the tune. It's Bill Haley and the Comets in 1956.
About the hair cell movie: The movie shows an outer hair cell which has been patch clamped using a whole cell recording pipette at its basal end. This allows the membrane potential of the cell to be varied. The low frequency envelope of RatC is played into the stimulus input socket of the patch amplifier, with a peak-to-peak amplitude of about 100 mV. The hair cell changes length - but at constant volume - because it has a motor molecule in the membrane along the cell sides which responds to membrane voltage by changing area.
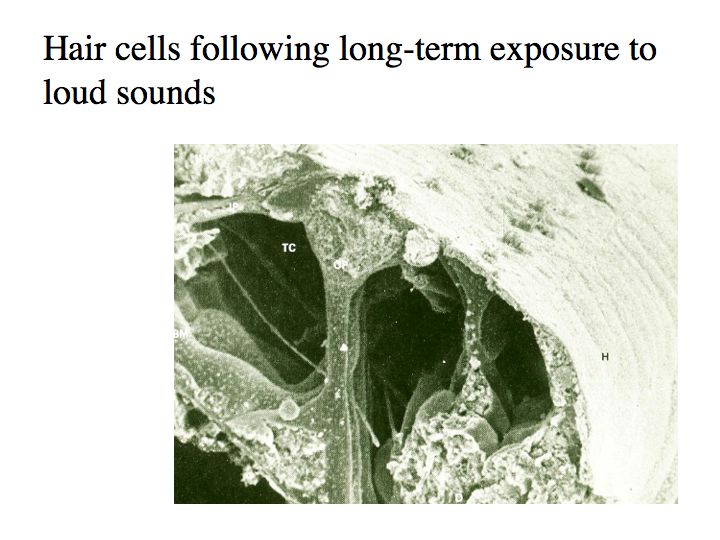
Electron microscope picture of a chinchilla's hair cells after hearing was damaged by acoustic overstimulation. The effects of sound damage on the outer hair cells are devastating, as the cells are now missing. The next time you go to a loud club or rock concert, consider wearing earplugs or some kind of hearing protection.