For a simple, online introduction to color vision, see "Breaking the Code of Color" at the Howard Hughes Medical Institute web page:
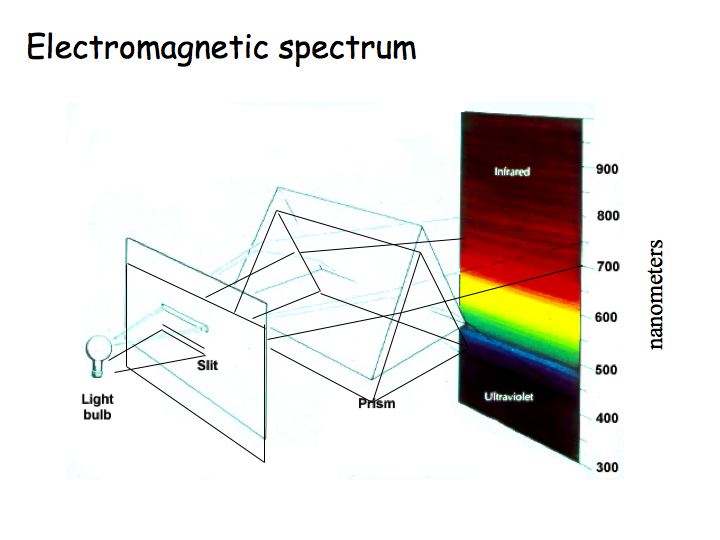
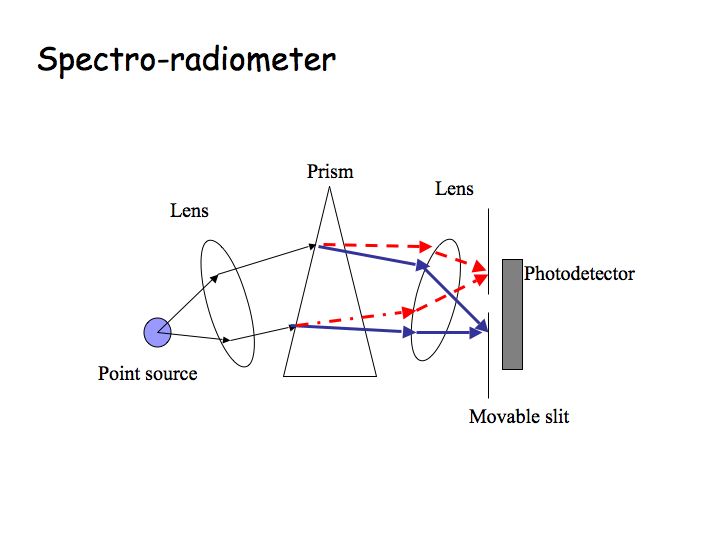
Spectral power distribution (SPD) is a plot of energy versus wavelength. The SPD can be measured using a spectro-radiometer. The diagram below of a spectro-radiometer shows a light source, a prism that splits the light into its separate components, a slit that passes only a narrow band of wavelengths (ideally it would pass only one wavelength), and a photodetector that measures how much light there is at that wavelength. By moving the slit and detector, one can measure the amount of energy at each wavelength. Most lights contain energy at many wavelengths. A light that contains only one wavelength is called a monochromatic light. Any light can be characterized as the sum of a bunch of monochromatic lights, and that is what is plotted in the SPD graph (note that this is just like characterizing a sound as the sum of a bunch of pure tones). You can tell from the SPDs plotted below that both of those lights will have a reddish-yellowish appearance because most of the energy is at the long wavelengths.

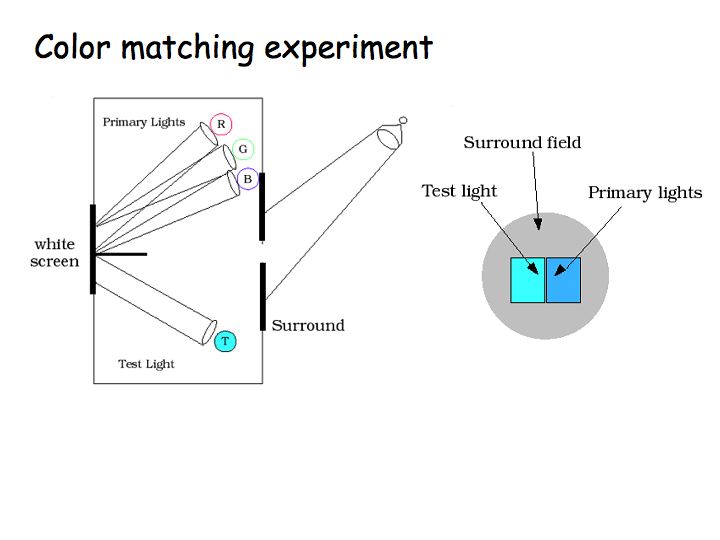
This figure is a diagram of the classic color matching experiment. A box is split into two chambers, one chamber has a test light, the other chamber has three primary lights (the 3 primaries can be almost any 3 light sources as long as they are different from one another). A small hole in the box allows a subject to see the colors from the 2 chambers right next to one another. The subject's task is to adjust 3 knobs that set the intensities of the 3 primaries so as to match the test light as closely as possible.
The results:
The SPDs shown above are a pair of metamers: two lights that are physically different, yet look identical. The one on the left is the SPD of the light coming from the sun. The one of the right is the SPD of the light coming from a TV screen. The intensities of the red, green, and blue phosphors in the TV were adjusted to give a perceptual match to the color of sunlight.
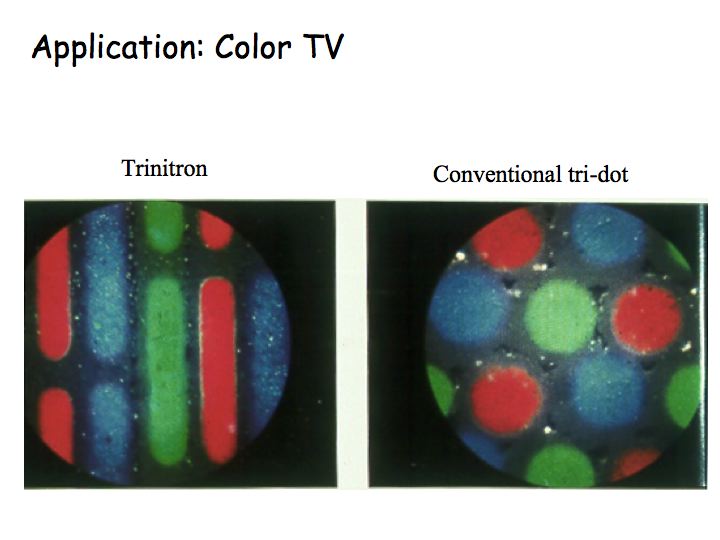
The color matching experiment is the basis for the design of color TV. Three types of phosphors are painted on the CRT screen that glow red, green and blue. Yet, the TV can produce the appearance of most colors (yellow, purple, orange, etc.). The designers of color TV took advantage of the results of the color matching experiment: 3 primaries are all you need.
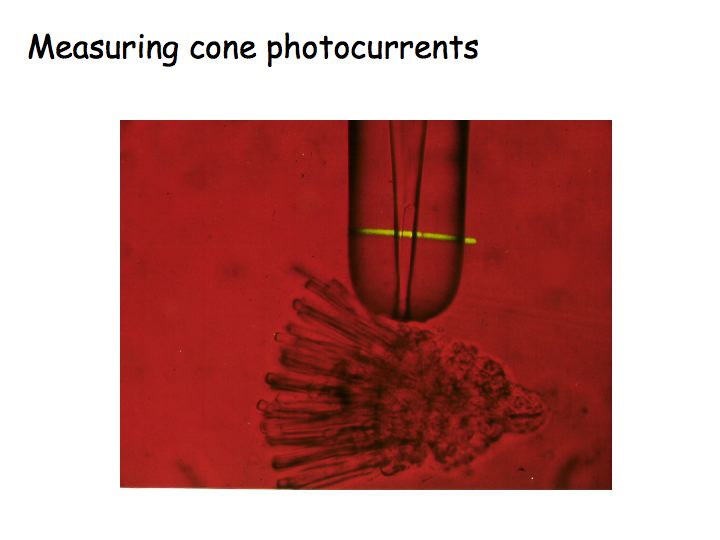
Denis Baylor, at Stanford, measured the spectral sensitivities of macaque monkey rods and cones. To do this, you chop up the retina. Then, you manage to get a single rod or cone into a glass pipette. Then, you shine a light on it and measure the resulting electrical current. This is repeated for many different wavelengths and for each of the three cone classes.
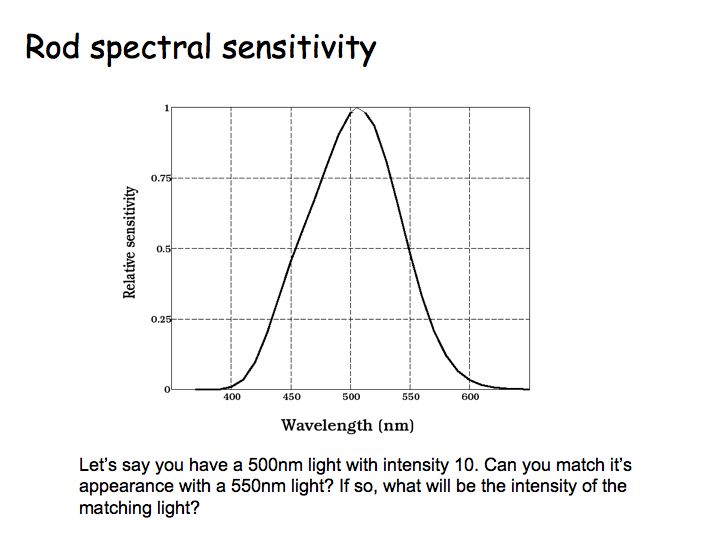
The figure above shows plots of rod spectral sensitivity - relative response versus wavelength - from Baylor's measurements. The height of the curve at a certain wavelength corresponds to the probability that a photopigment molecule will absorb (and isomerize) a photon of light with that wavelength. The greater the probability of isomerization, the greater the response from the cone. Rods are most sensitive to 500 nm monochromatic light. Note that 500 nm is a pretty short wavelength - the range of wavelengths in visible light is about 400-700nm. Most cones are sensitive to longer wavelengths than this. Because of this, the brightness of a blue object compared to a red one increases during dark adaptation, called the Purkinje shift.
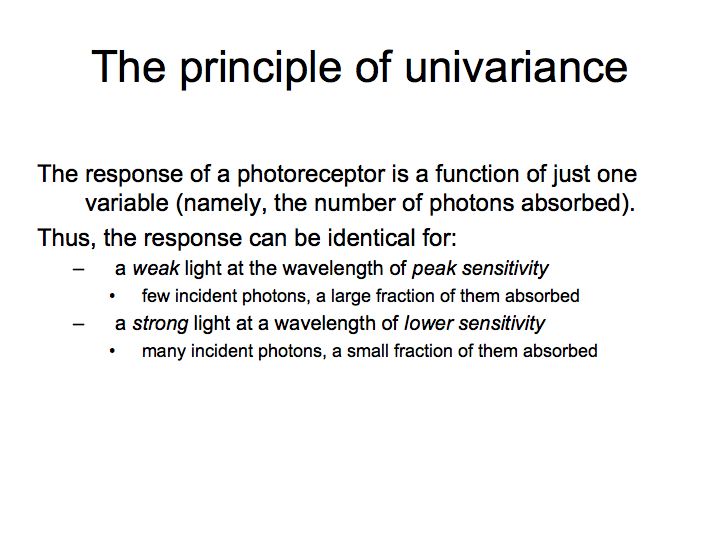
You may have noticed that under low light conditions (when your eye is dark adapted), you don't see colors. Rather, everything appears as some shade of gray. All rods have the same photopigment (rhodopsin) and hence all rods have the same spectral sensitivity. With only one spectral sensitivity, there's no way to discriminate wavelength. Wavelength is totally confounded with intensity - this is the principle of univariance.
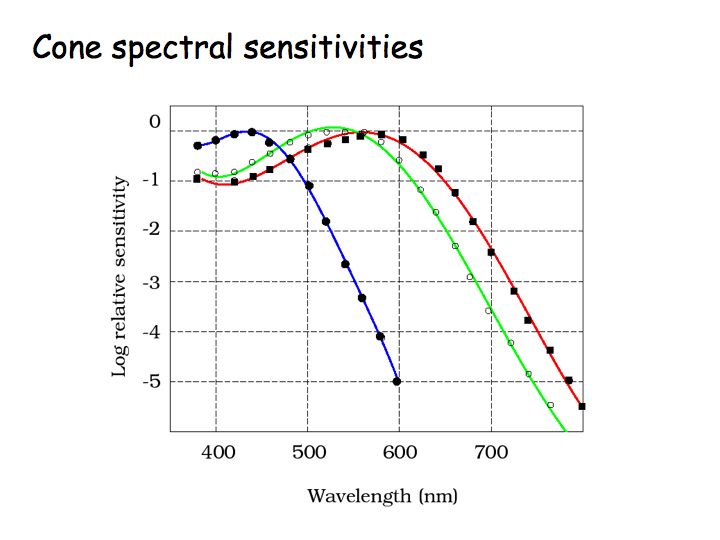
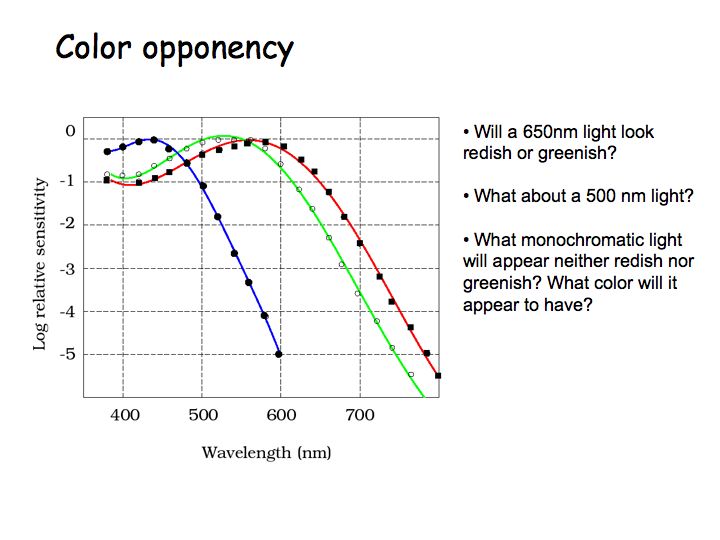
The figure above shows plots of the cone spectral sensitivities - relative response versus wavelength - for each of the 3 cone types. S cones are most sensitive to short wavelengths. L cones are most sensitive to long wavelengths. M cones' peak sensitivity is to middle wavelengths. Note that the y-axis is on a log scale. These are amazing measurements, precise to 6 orders of magnitude.
Changing the wavelength of a monochromatic light changes the relative responses of the three cone types. This is the basis of your ability to discriminate the colors of the rainbow (wavelength discrimination). Each wavelength evokes a unique ratio of cone responses.
The cone responses to any test light can be computed by multiplying the test light SPD by the spectral sensitivities of each cone, and then summing over wavelength.
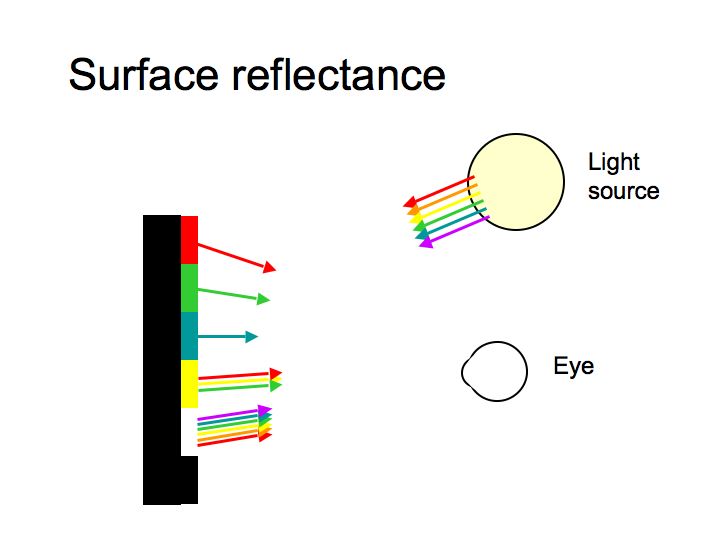
The SPD of light reaching the eye depends on the SPD of the light source multiplied by the surface reflectance. The response of each photoreceptor depends on the SPD of the light reaching the eye multiplied by the spectral sensitivity of the photopigment.
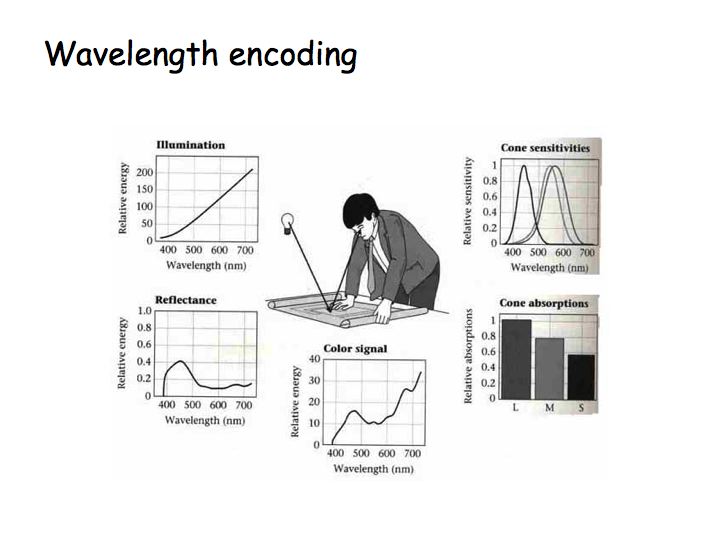
Each point of a scene is illuminated by various light sources, each of which has its own SPD (upper-left). Surfaces are characterized by the proportion of the light landing on them that is reflected (e.g., towards your eye), known as a spectral reflectance function (below-left in the figure). This surface is blueish, as it mostly reflects short-wavelength light. The product (wavelength by wavelength) of the illuminant and reflectance yields the color signal, which is the SPD of the light heading toward your eye from the surface. This signal is analyzed by your three cone photoreceptors, which respond differentially due to their individual spectral sensitivities (above-right). The only information your brain has to work with to characterize the color percept of each point in the scene is the set of three responses to each surface by the three cone types (below-right).
Color mixture: An issue that is can be confusing about color and trichromacy concerns that colored lights behave differently from colored pigments.
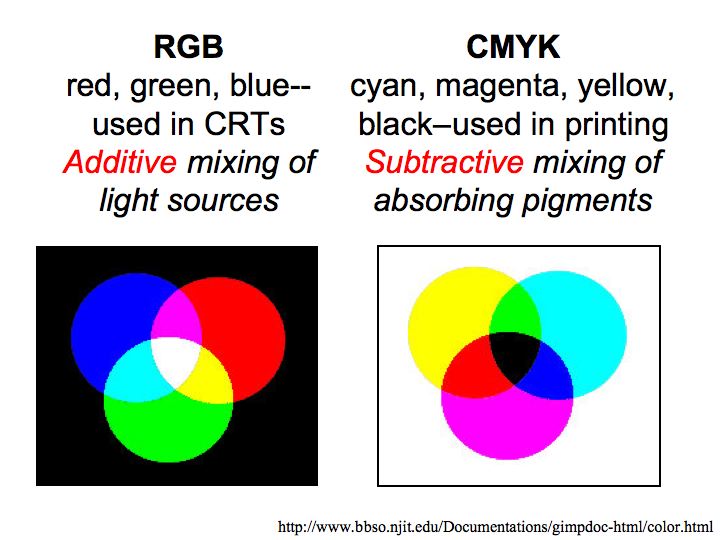
Lights mix "additively" meaning that the spectral power distribution of the sum of two lights is the sum of the two spectral power distributions. Mixing more of one of the primaries gives more light. This is what happens when you control the intensities of the 3 primary lights in the color matching experiment or when your TV presents color with a mixture of 3 phosphors. "Subtractive" color mixture is the term that is used when mixing pigments (like paints or inks). In this case, it is the absorption of the pigments that is being combined. Mixing more of one of the pigments gives less reflected light. The spectral power distribution of a light reflecting off of a pigmented surface depends is the spectral power of the incident light multiplied by the reflectance of the surface. Mixing more pigment (more paint) reduces the reflectance (absorbs more light) and hence reduces the spectral power distribution of the reflected light at one or more wavelengths.
Summary of trichromacy theory: There are three cone types that differ in their photopigments. The three photopigments are each selective for a different range of wavelengths. If two lights evoke the same responses in the three cone types, then the two lights will look the same. All that matters is the excitation in the three cone types. Each cone outputs only a single number (i.e., satisfies univariance). It tells us how many photons it has absorbed, but nothing about which photons they were (i.e., which wavelength). There are lots of lights out there that are physically different, but result in the same cone excitations (such lights are called metamers). Trichromacy is the basis of color technology in the print industry and color TV.
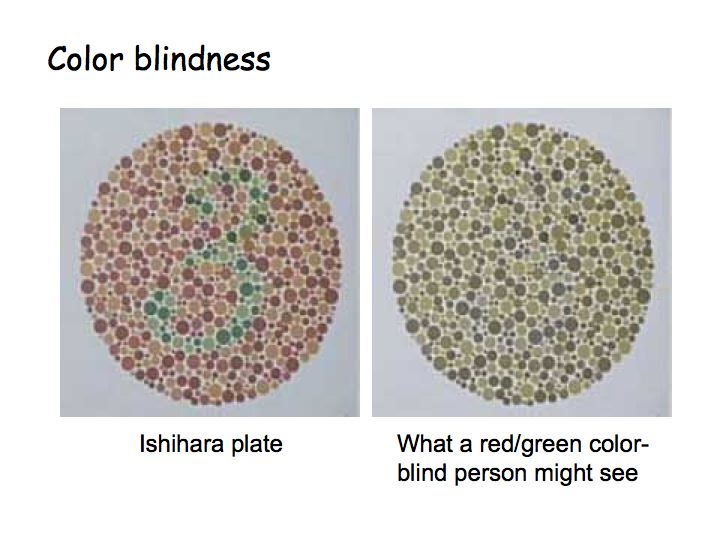
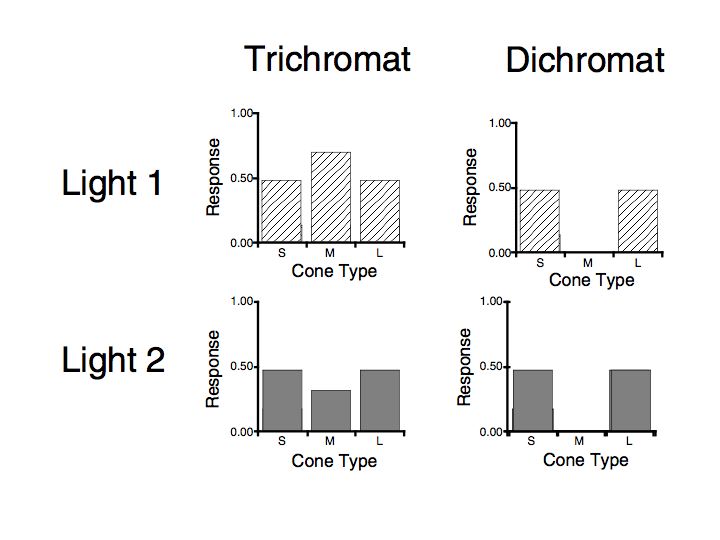
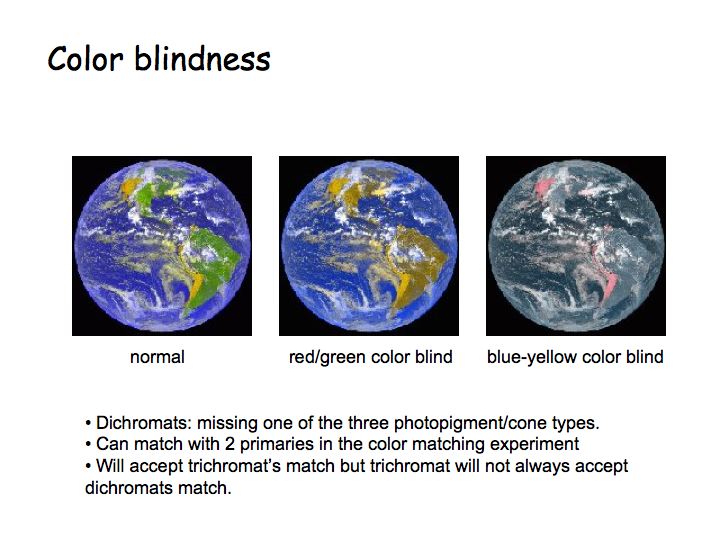
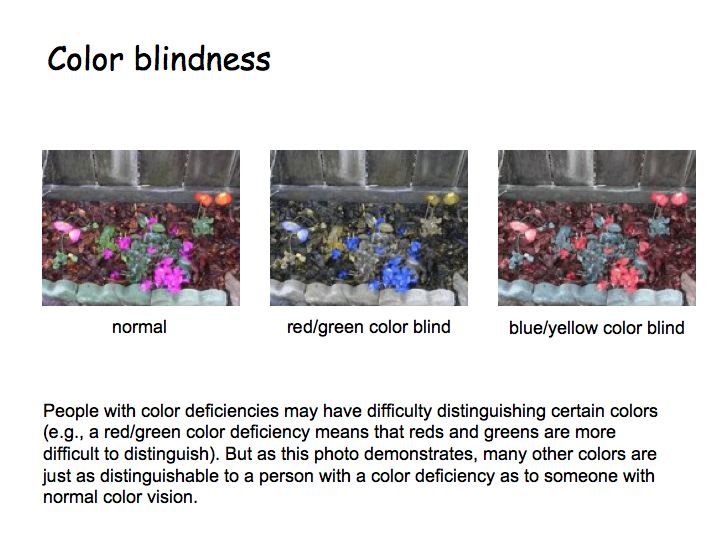
Color blindness: There are two basic forms of color blindness. Either the person has only a single type of receptor (called a monochromat) or has 2 types (and is called a dichromat).
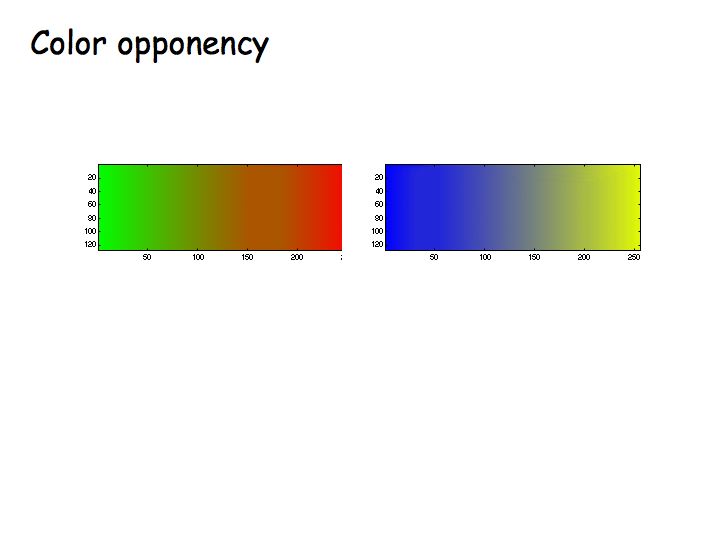
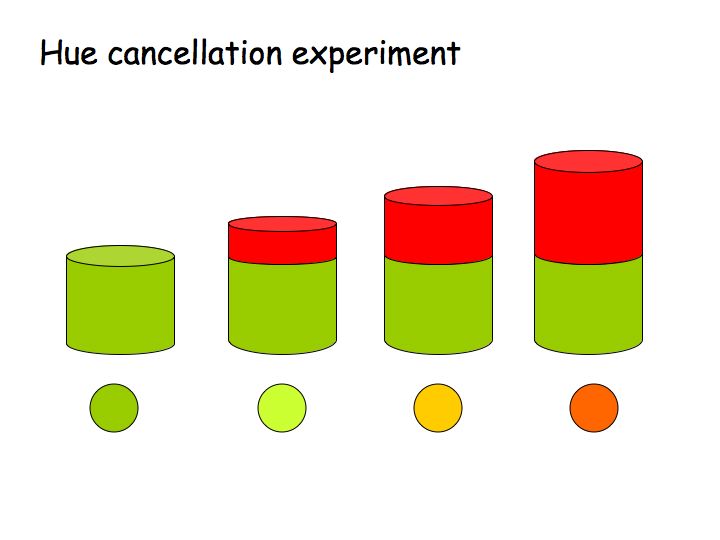
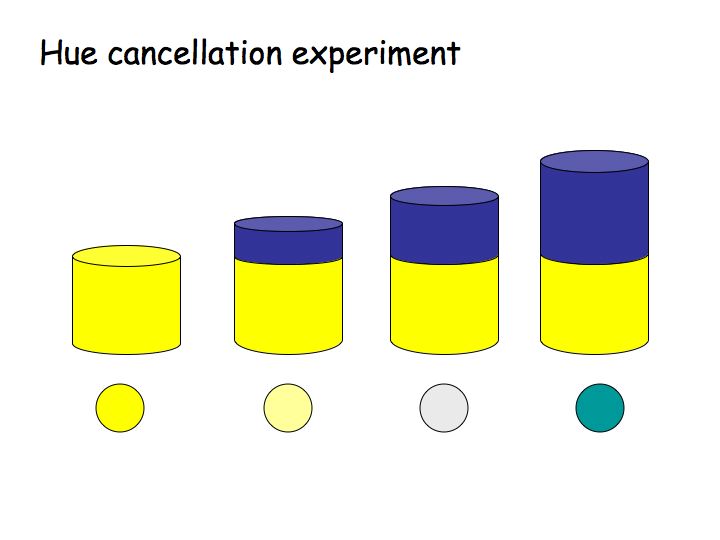
Color opponency was established with the hue cancellation experiment, in which subjects were instructed to adjust a mixture of red and green lights until it appeared neither redish nor greenish. At this point, it typically appeared yellow (notable, not redish-greenish). Likewise, one can adjust a mixture of blue and yellow lights to appear neither blueish nor yellowish.
For many years, the notion of opponent colors was viewed as a competing/alternate theory to trichromacy. Today, we understand how the two theories fit together.
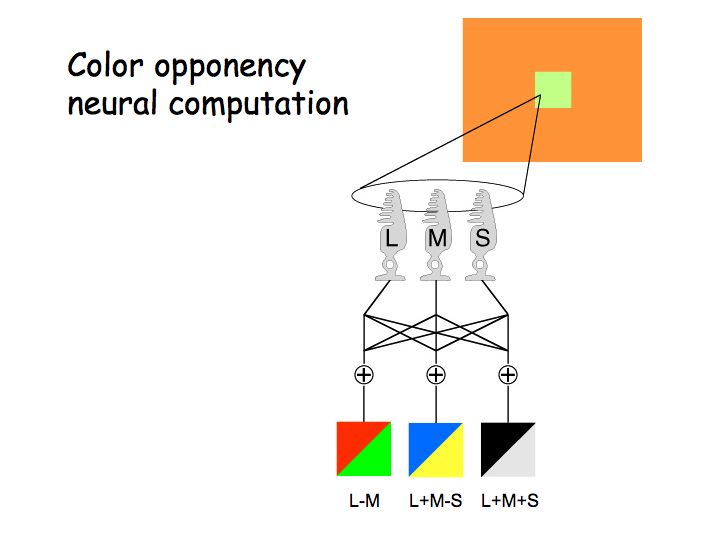
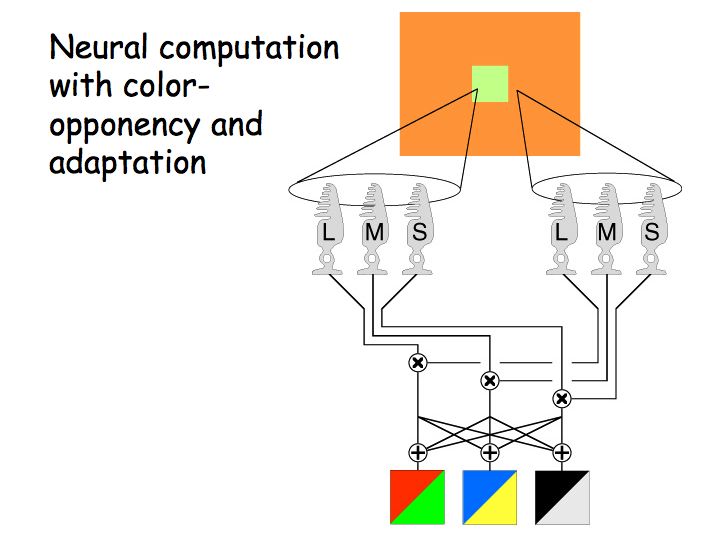
Trichromacy falls out from the fact that you have three cone types with different spectral sensitivities. In the retina, the cone signals get recombined into opponent mechanisms:
A color appears reddish when the red/green mechanism gives a positive response, greenish when the red/green mechanism gives a negative response. Likewise for yellow/blue.
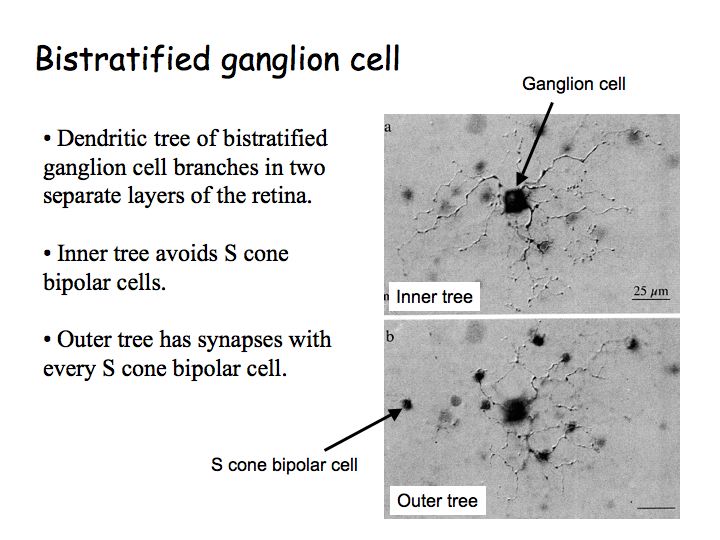
Color opponency in the retina: Color opponency requires very specific wiring in the retina. The blue-yellow mechanism, for example, must receive complementary inputs from specific cone types (e.g., inhibition from S cones, excitation from L and M cones). Anatomists have identified a special subclass of ganglion cells, called bistratified cells, that do just that. The anatomical substrate for red/green opponency is still unknown.
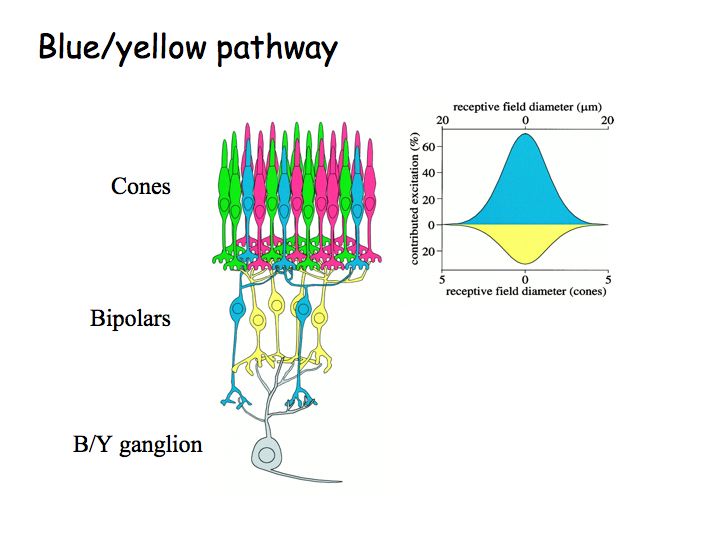
This figure is a diagram of the blue-yellow pathway in the retina. S cones (shown in blue in the figure) connect to a special subclass of bipolar cells (called the S-cone bipolar cells). L and M cones connect to another type of bipolar cells. The B/Y bistratified ganglion cell receives complementary inputs from the two bipolar cell classes, providing excitation from the S cones and inhibition of the the L and M cones.
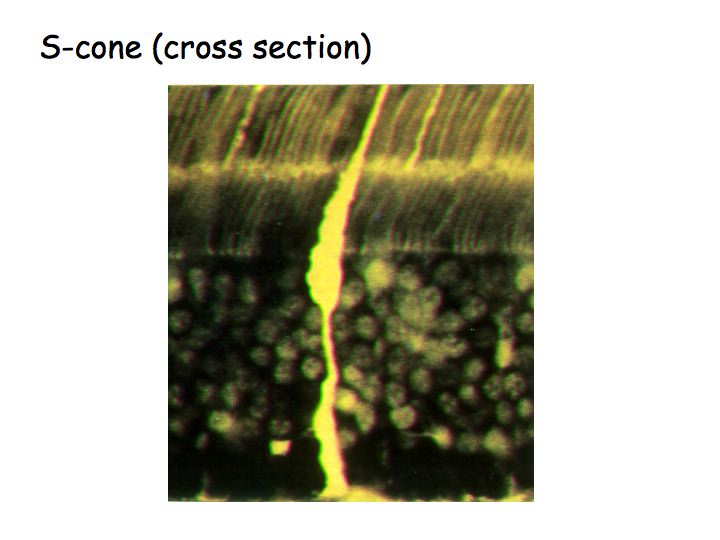
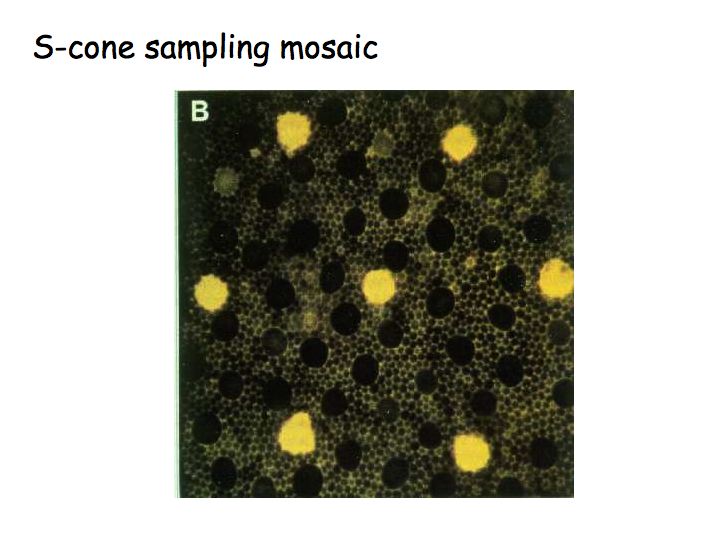
In this figure, the S cones are filled with flourescent dye. It turns out to be easy to stain the S cones, because their photopigment is very different from the other two types. Most of the cones are L and M cones, there are only a few S cones. Because it's easy to find the S cones, anatomists have been able to identify the retinal circuitry for blue-yellow.
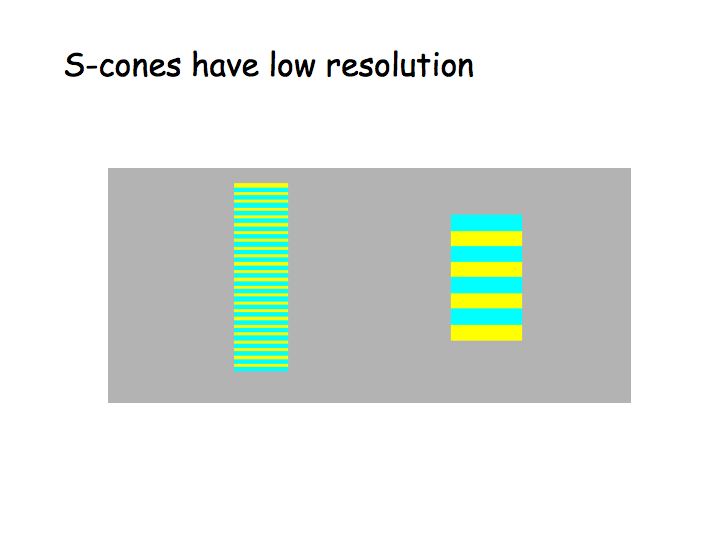
Note that there aren't very many S cones (yellow in the above pictures) compared to the L and M cones (dark in the above pictures). As a consequence of this, the blue-yellow pathway has poor spatial resolution. The blue and yellow colors in the stripes below are all the same. When viewed from a sufficiently large distance, the fat stripes look more saturated than the thin stripes because the thin stripes are at the spatial resolution limit of the S cone mosaic.
Take a photograph under flourescent light, and compare it to the same picture taken under daylight. The colors come out totally differently - greenish under the flourescent light and reddish under daylight - unless you do some "color correction" while developing the film.
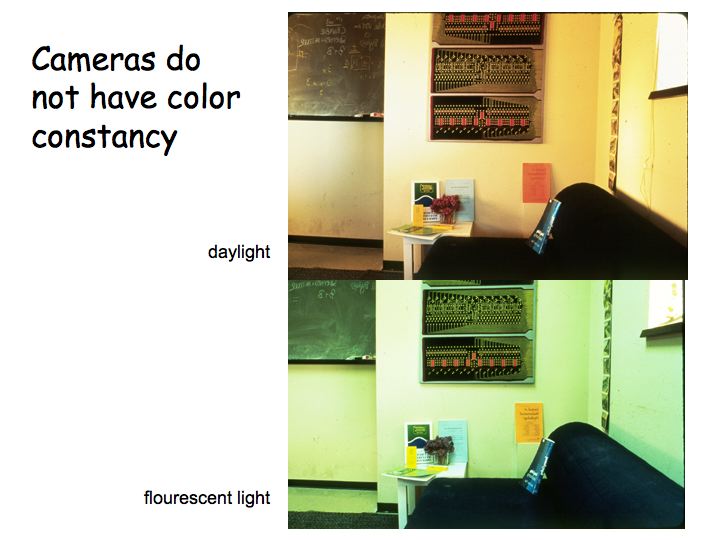
But you wouldn't see it that way if you were in the room. To you the colors would look pretty much the same under both illuminants. This phenomenon is called color constancy, analogous to brightness constancy that we discussed earlier. The eye does not act like a camera, simply recording the image. Rather, the eye adapts to compensate for the color (SPD) of the light source.
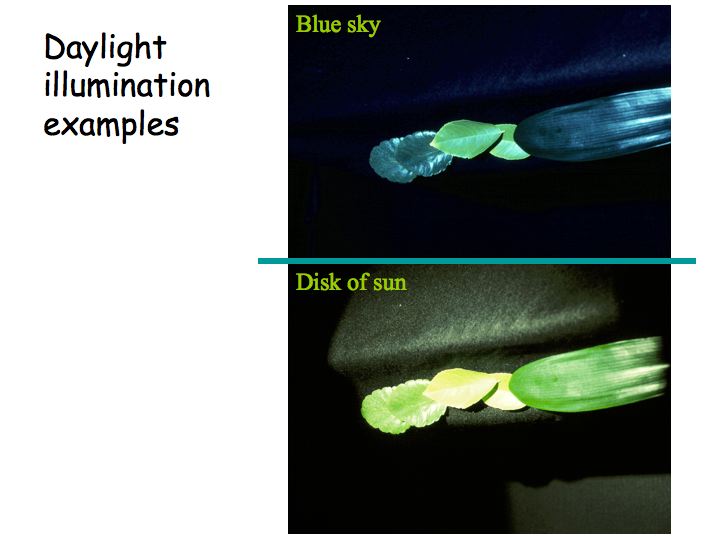
Above is another example of a pair of photographs taken under different lighting conditions without color correction. The physical characteristics of the light reaching the camera is very different depending on the color of the illuminant. This results in dramatically different photographs. But if you were there when the pictures were taken, this object would look pretty much the same to you under both illuminants.
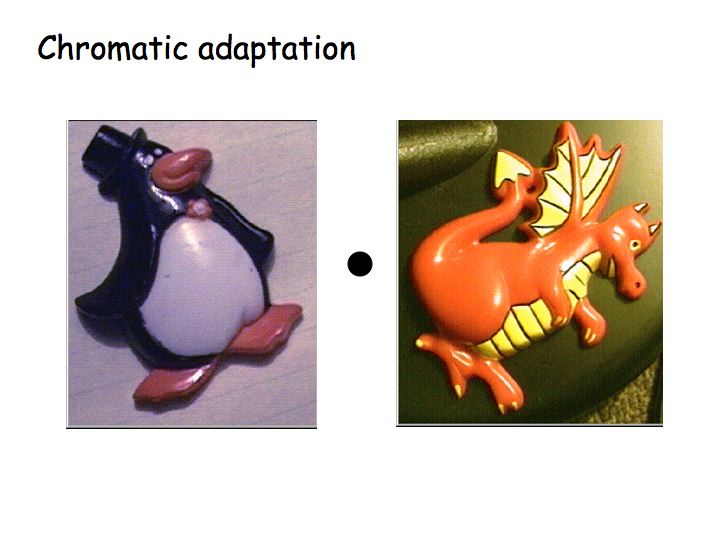
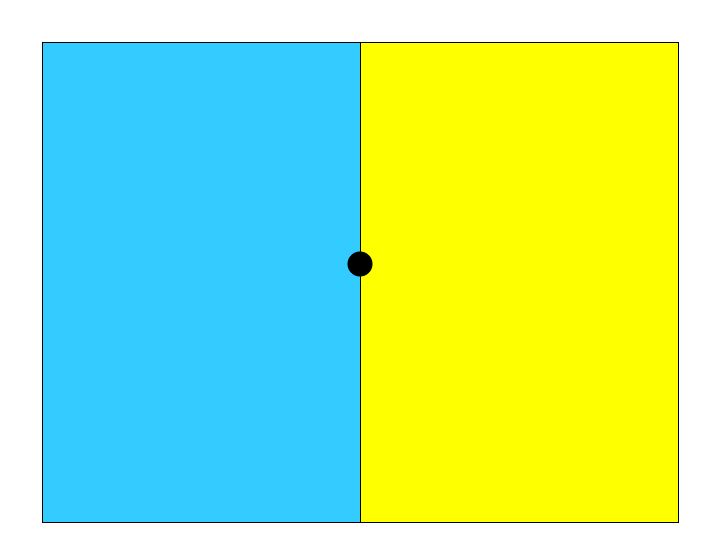
Glance at the penguin and dragon pictures above by fixated on the dot between them. The penguin picture looks very blueish and the dragon looks very yellowish. Next, you will hold your gaze on the dot between the blue and yellow fields. Continue staring at that dot for 30 secs or so. Then look back at the penguin and dragon by fixating the dot between them. What do you see? Why?
The change in percept following adaptation is due to chromatic adaptation. Chromatic adaptation is like light and dark adaptation but instead of adapting just to light and dark, it adapts to whatever the color is of the ambient illumination.
Each cone type adapts independently. For example, a given L cone adapts according to local average L cone excitation. Likewise for the M cones. Thus, the retinal image adjusts to compensate not only for the overall intensity of the light source, but also to compensate for the color of the light source.
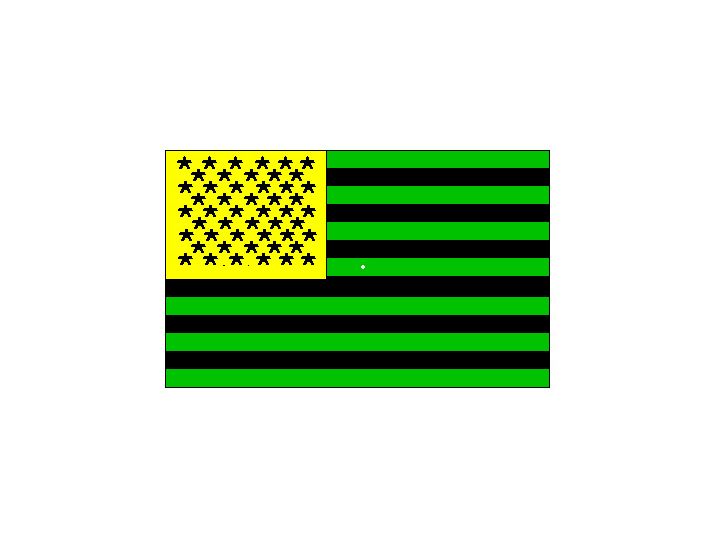
Chromatic adaptation, like light adaptation, can give rise to dramatic aftereffects. For example, adapt to this green, black, and yellow flag for 60 secs, then look at a white field and you will see an afterimage of a red, white, and blue flag. Red/green, blue/yellow, black/white are complementary colors. Normally, when you look at a white field, L and M cones give about the same response so the red/green opponnent colors mechanism does not respond at all. If you adapt to green, the M cone sensitivity is reduced. Then, when you look at a white field, the L:M cones are out of balance; the L cones are now more sensitive than the M cones so the red/green mechanism gives a positive response and you see red instead of white. This only lasts for a couple of seconds because the M cone sensitivity starts to readjust right away.
The visual system is designed to try to achieve a perceptual constancy. But, as with the various brightness illusions I showed earlier, color adaptation also results in some misperceptions. The colored afterimage is an undesirable consequence of chromatic adaptation coupled with color opponency. Usually chromatic adaptation does the right thing, it compensates for the color of the illuminant.
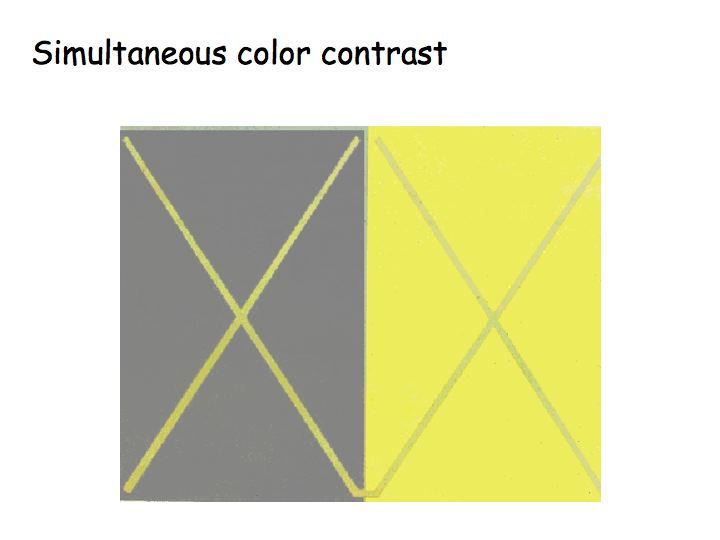
Simultaneous color contrast (analogous to simultaneous brightness contrast). The X on the left is surrounded by yellow. The X on the right is surrounded by gray. The paint/pigment of the two X's is identical, yet the color appearance is quite different because the surrounding context is different. Color perception, like brightness perception, depends on contrast/surrounding context.
The visual system manages, under most circumstances, to get a consistent percept of surface color, despite changes in the illuminant, based on the three cone responses across the scene. This is an amazing feat given that you only have three numbers for each surface (the cone responses), and use these to get a constant perception of spectral reflectance (which is a whole bunch of numbers, one for each wavelength, not just three numbers) despite changes in the illuminant (whose SPD is yet another whole bunch of numbers, one for each wavelength).