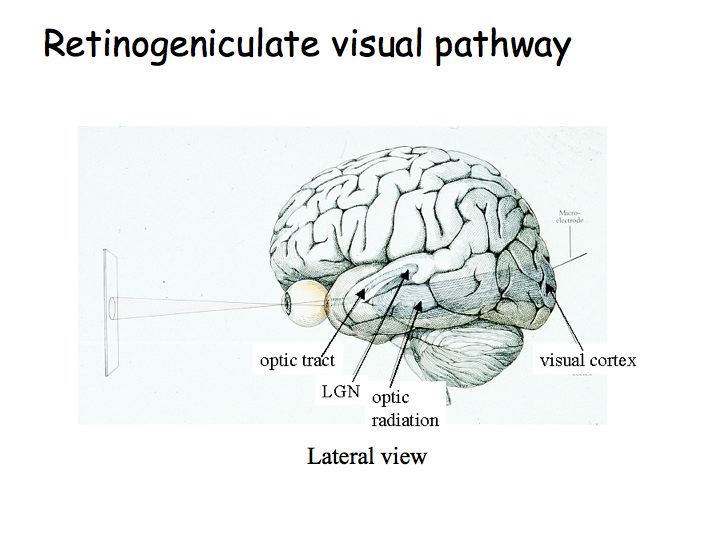
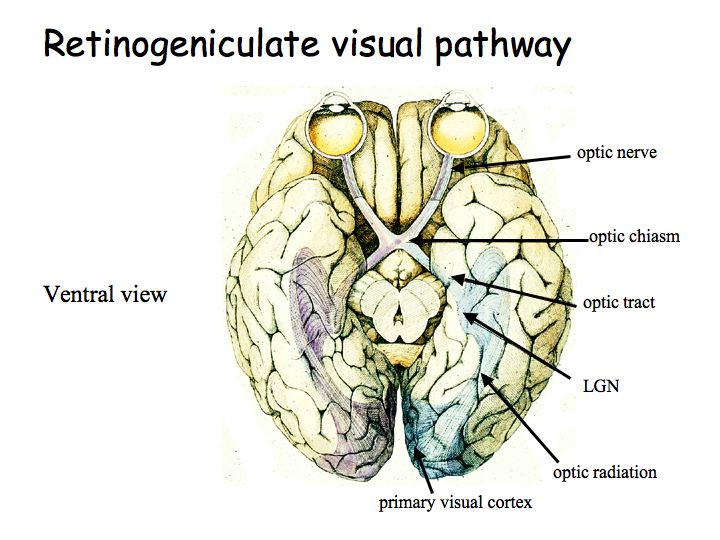
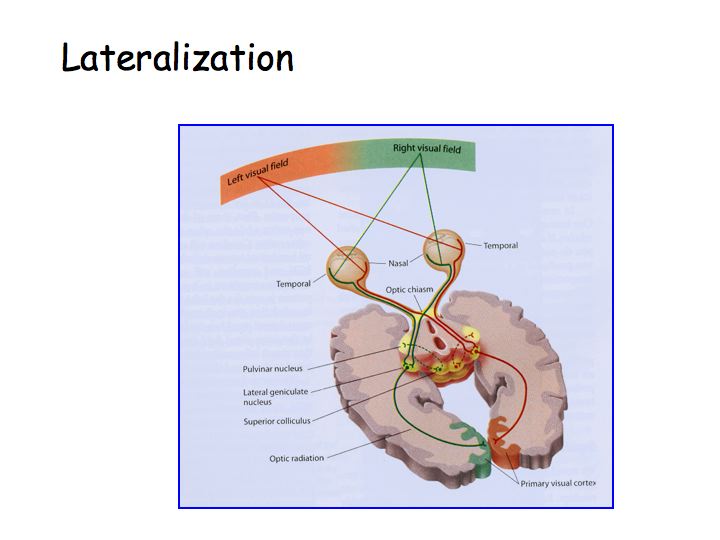
The optic nerve leads from the eye to the optic chiasm. The optic chiasm is where some of the fibers cross. The optic tract proceeds from the optic chiasm to the lateral geniculate nucleus (LGN). The optic radiation leads from the LGN to primary visual cortex (V1).
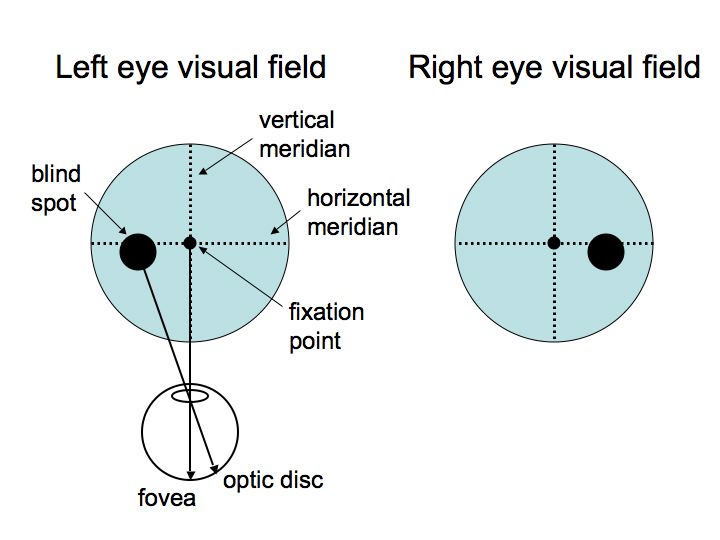
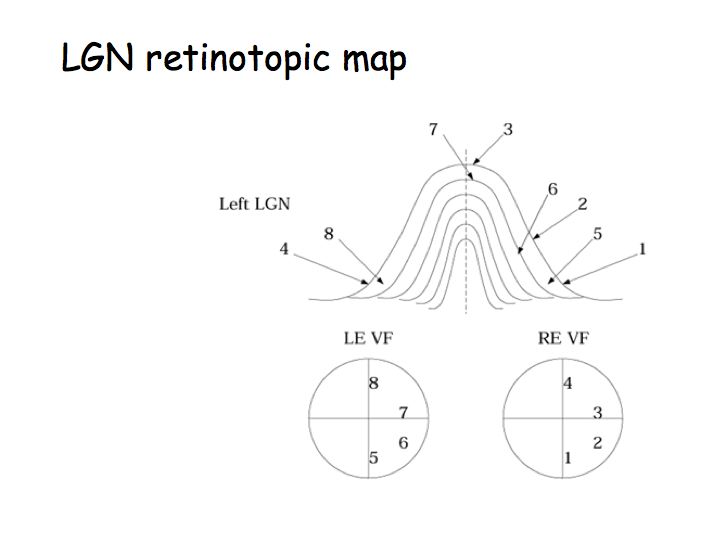
There are two eyes, thus we illustrate two visual fields. The fixation point is the center of the visual field; it corresponds to the fovea. T he vertical meridian splits the visual fields into left and right hemi-fields. The horizontal meridian splits the visual field into upper and lower hemi-fields. The blind spot is the region of the visual field that corresponds to the optic disc.
Principle of lateralization: The right half of the brain receives sensory information from and sends motor commands to the left half of body. In the visual system, the right half of the brain receives information about the left half of the visual field (note: not just from the left eye). Note that the fibers cross over at the optic chiasm.
Visual deficits due to lesions at different points in the pathway: Suppose someone comes in complaining of vision problems. Do you send them to an ophthalmologist or to a neurologist? Is the problem an eye disease? Or is it some central problem like a tumor pressing on the optic tract?
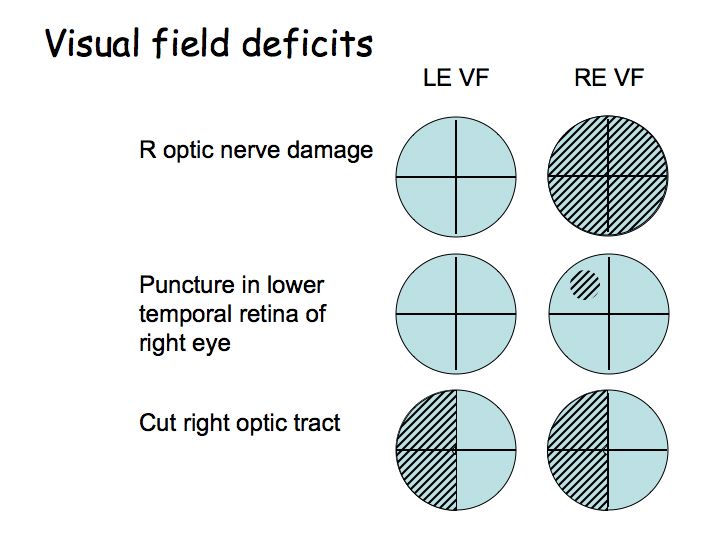
If the deficit is in only one eye's visual field, send the patient to an ophthalmologist. If the deficit is in corresponding parts of both eye's visual fields, then it is a central problem, and send the patient to an neurologist for an MRI or CT scan.
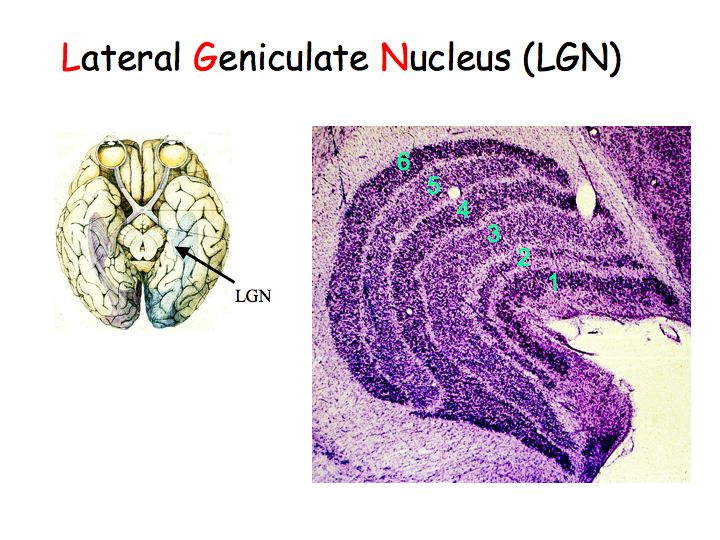
In the LGN, cells have center-surround receptive fields just like retinal ganglion cells. There is little or no information processing beyond that done in the retina, so what is the function of the LGN? Why not send axons directly to cortex? Nobody knows for sure. There are two compelling hypotheses that I know of:
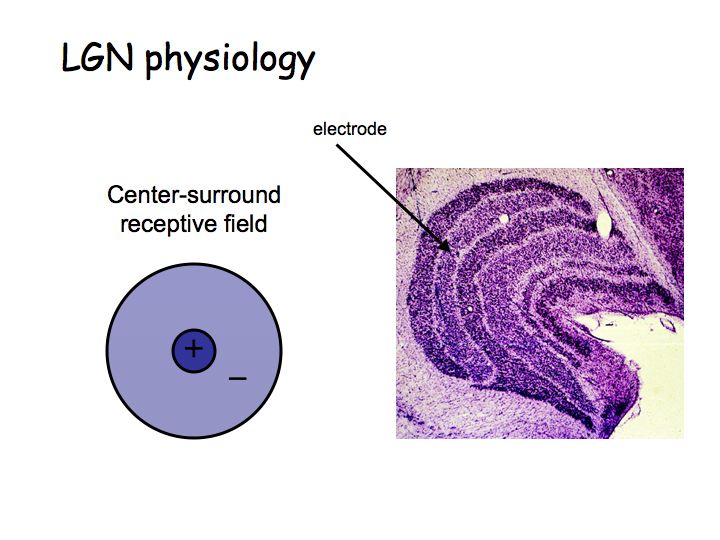
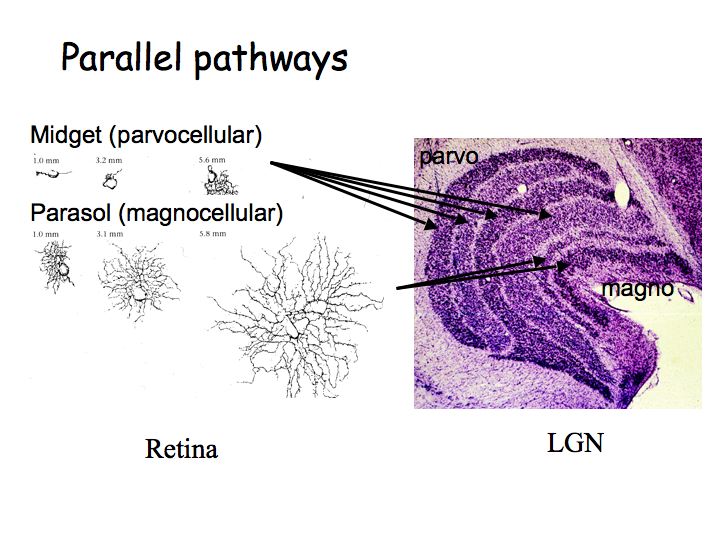
All 6 layers of LGN project to area V1 in cortex. The magno and parvo layers project separately in the input layers of V1, but then these parallel pathways (that originated in the retina) get pretty much completely merged in subsequent areas.
The figure below shows the results of an experiment in which an anaesthetized monkey viewed a flickering bulls-eye pattern, and was injected with radioactively labeled glucose. The glucose was taken up by active neurons. The animal was then sacrificed, and V1 was surgically removed and flattened. The flattened V1 was then used to expose radioactively sensitive film. The result is a picture of regions of activity evoked by the bulls-eye. As you can see, V1 maintains a retinotopic map.
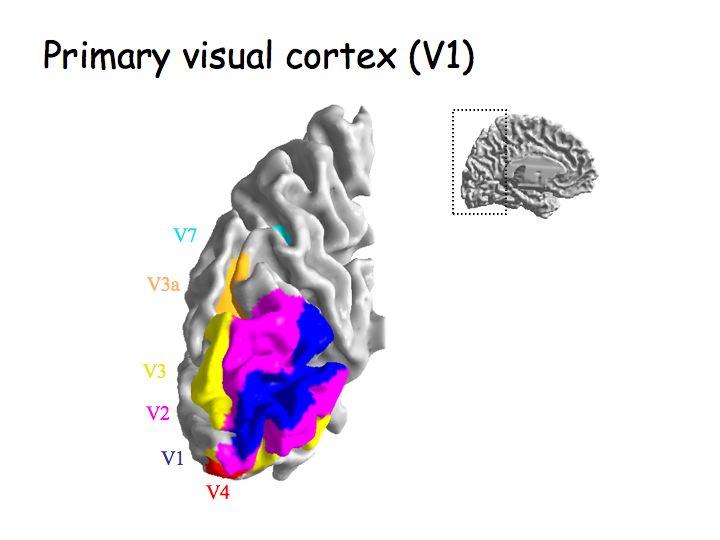
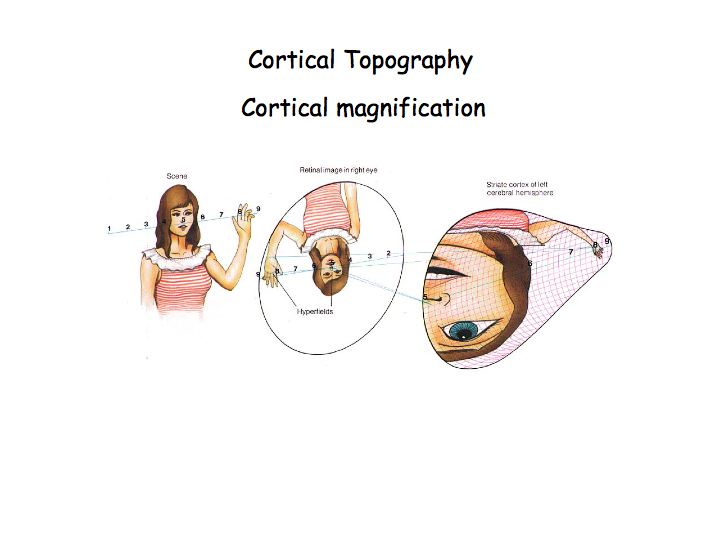
In the intact human brain, V1 is located in the occipital lobe. The retinotopic map is laid out across the folded cortical surface in the gray matter of the Calcarine sulcus. The central (foveal) part of the visual field is represented at the very back and more peripheral regions of the visual field are represented further forward (anterior). The retinotopic map is lateralized so that the left hemisphere V1 represents the right half of the visual field and vice versa.
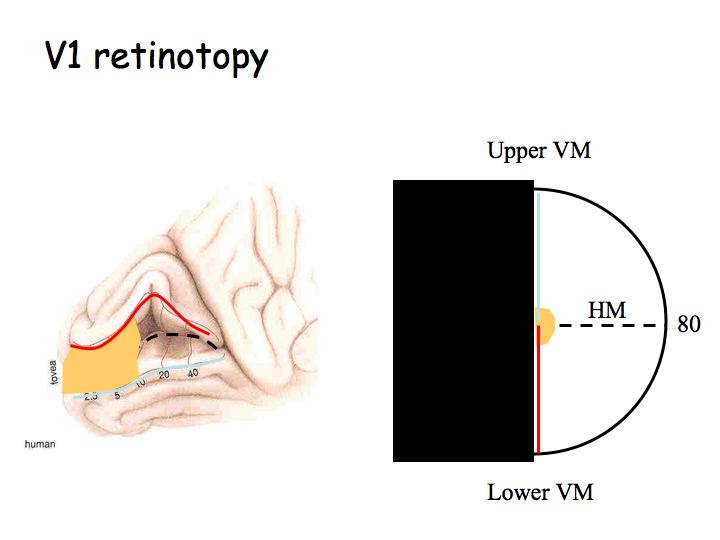
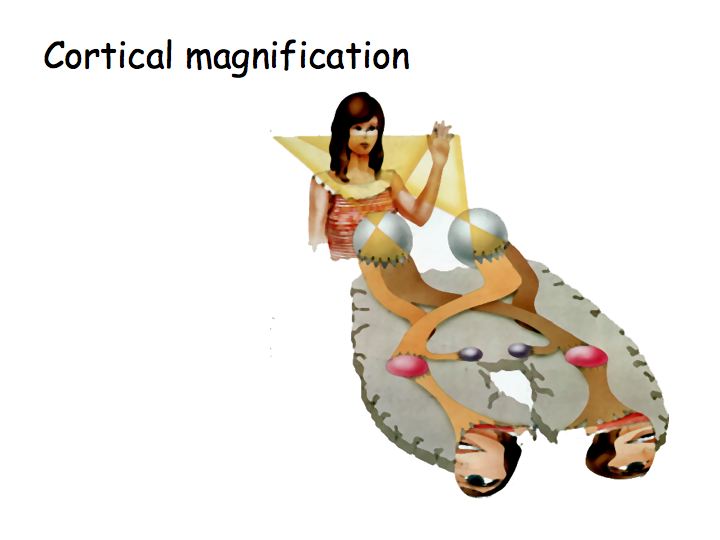
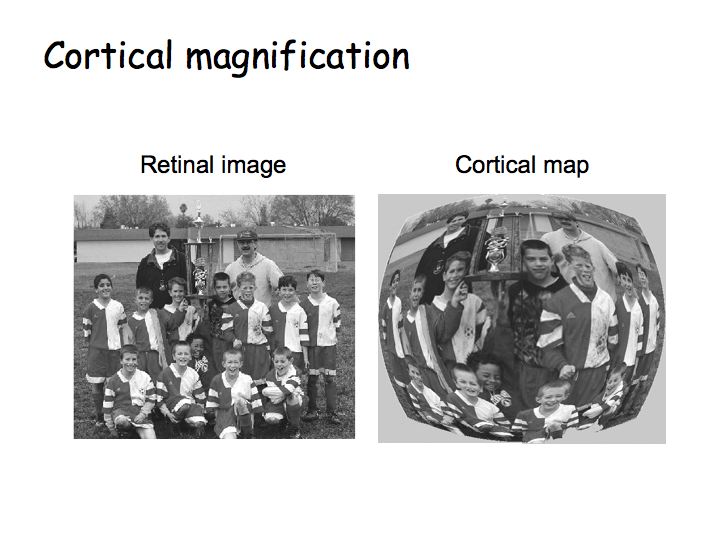
The retinotopic map in V1 is distorted so that the central 10 degrees of the visual field occupies roughly half of V1 (orange regions in the above diagram). This makes sense because of the poor acuity in the periphery (recall that peripheral ganglion cells have large dendritic trees and pool over many photoreceptors). The distortion is called cortical magnification.
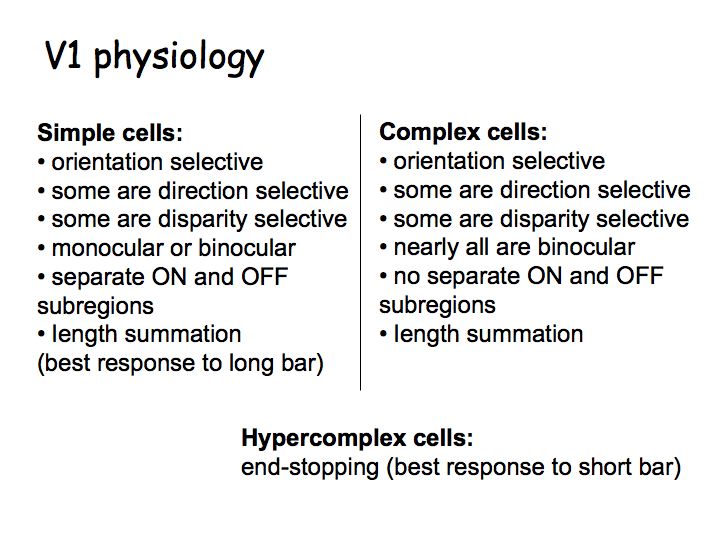
David Hubel and Torsten Wiesel won the Nobel prize for discovering the functional organization and basic physiology of neurons in V1. They discovered three different types of neurons that can be distinguished based on how they respond to visual stimuli that they called: simple cells, complex cells, and hypercomplex cells. V1 neurons transform information (unlike LGN cells whose receptive fields look just like those of ganglion cells) so that they are orientation selective and direction selective.
V1 physiology movie (200 Mb QuickTime movie)
In class we viewed a video that demonstrates how Hubel and Wiesel classified the various cell types and mapped their receptive fields. You can download this movie (clicking above) but be aware that it is a large movie file. The video shows visual stimuli while recording from each of several V1 neurons. The electrode was connected to an amplifier, and output to a loudspeaker. The audio track allows you to hear the loudspeaker - each click corresponds to an action potential. The movie shows examples of a simple cell, complex cell, direction-selective complex cell and a hypercomplex cell.
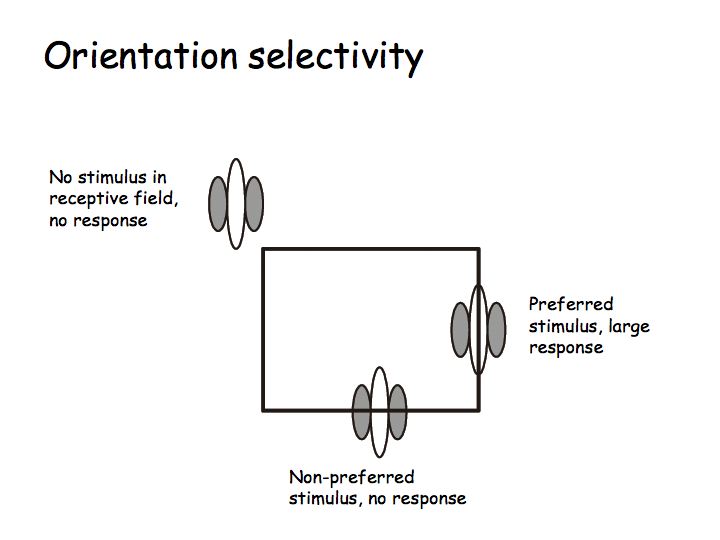
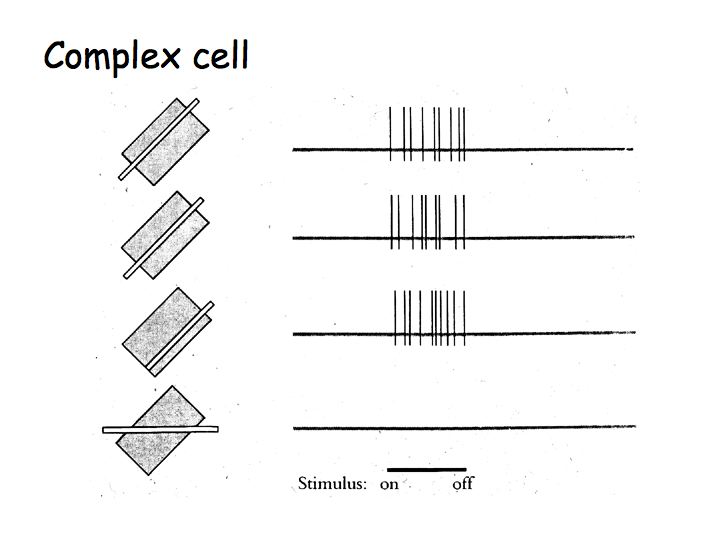
Orientation selectivity: Most V1 neurons are orientation selective meaning that they respond strongly to lines, bars, or edges of a particular orientation (e.g., vertical) but not to the orthogonal orientation (e.g., horizontal).
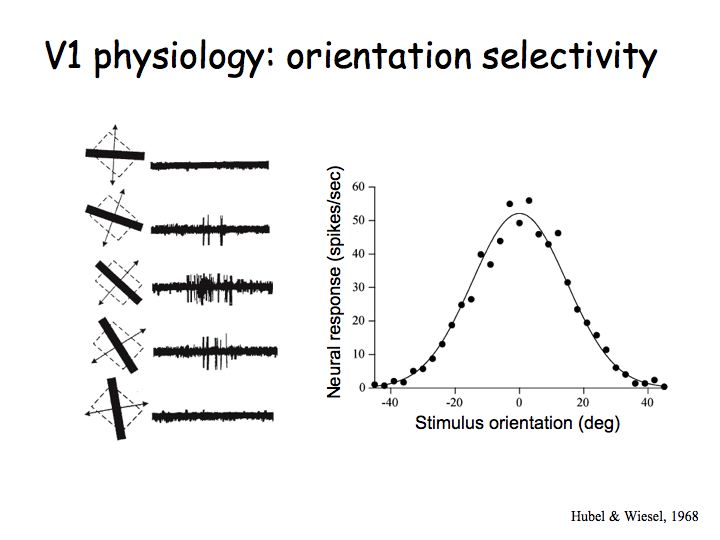
These are data from Hubel and Wiesel's early experiments on V1. The dashed rectantangles on the left indicate a V1 neuron's receptive field. The superimposed lines are the stimuli that were used. For each stimulus (each line orientation), Hubel and Wiesel recording how many action potentials were produced by this neuron. The middle row are exampls of the electrophysiological recordings for each of the corresponding stimulus orientations. The diagonal orientation (the middle row) evoked the greatest response (largest number of action potentials). The graph on the right shows the result after a whole bunch of measurements like these for each of a bunch of lines. There is a peak response for one particular orientation and weaker responses for other orientations, falling of to zero when the line orientaiton is about 40 degrees away from the neurons favorite (preferred) orientation).
Direction selectivity: Some V1 cells are also direction selective meaning that they respond strongly to oriented lines/bars/edges moving in a preferred direction (e.g., vertical lines moving to the right) but not at all in the opposite direction (e.g., vertical lines moving to the left).
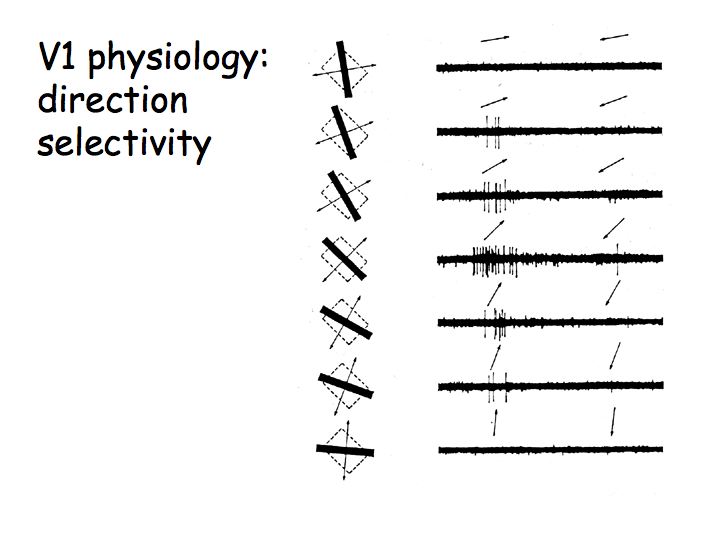
These are also data from Hubel & Wiesel's early experiments. The arrows above each electrophysiological recording indicate the direction of motion. This V1 neuron responds best to up-right motion but not at all to down-left motion.
Simple cells
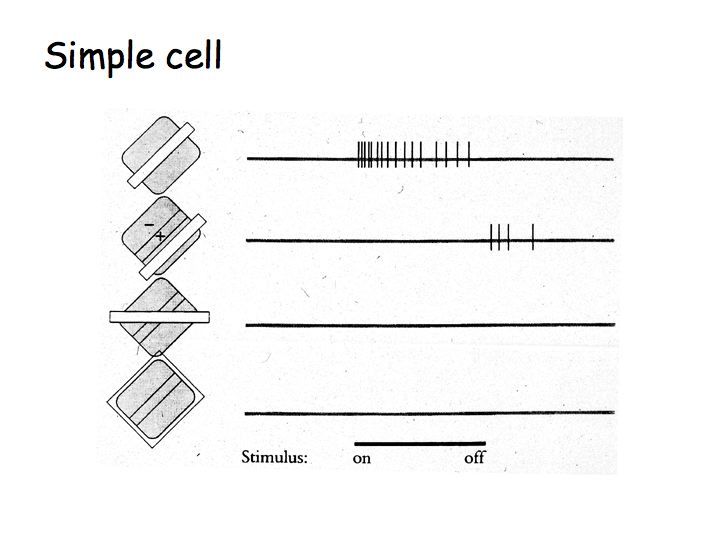
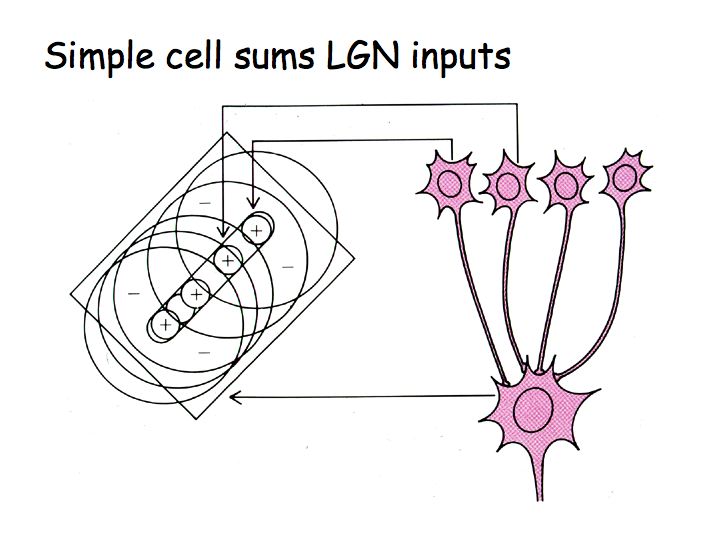
A simple model of simple cell responses, suggested by Hubel and Wiesel, is that each simple cell sums inputs from LGN neurons with neighboring/aligned receptive fields to build an elongated receptive field that is most responsive to elongated bars or edges.
Hypercomplex cells
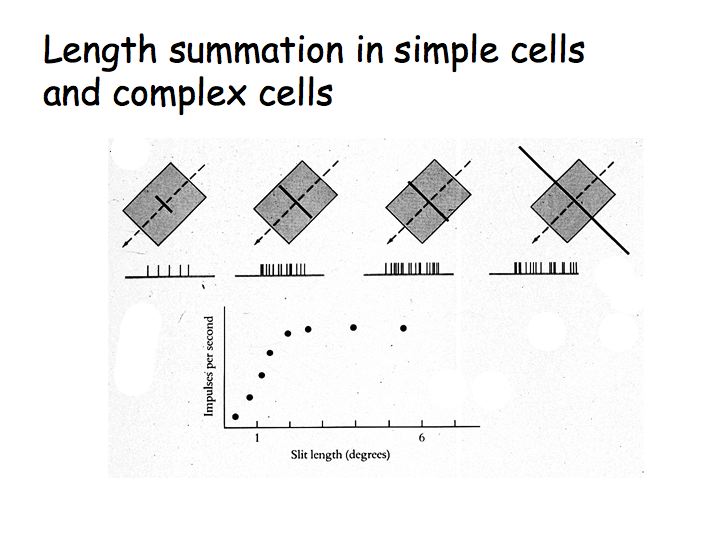
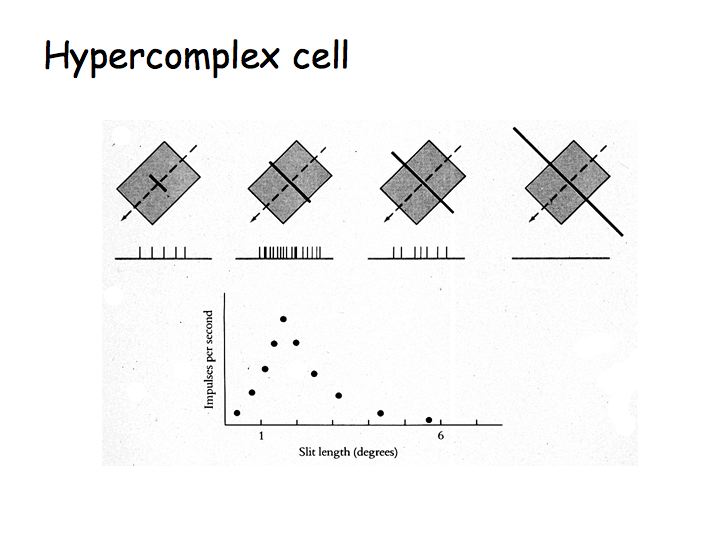
Hypercomplex cells are like complex cells except there are inhibitory flanks on the ends of the receptive field, so that response increases with increasing bar length up to some limit, but then as the bar is made longer the response is inhibited. This property is called end-stopping. The upper graph shows the response of a complex cell as a function of bar length. The lower graph shows the response of a hypercomplex cell as a function of bar length.
Summary of V1 physiology
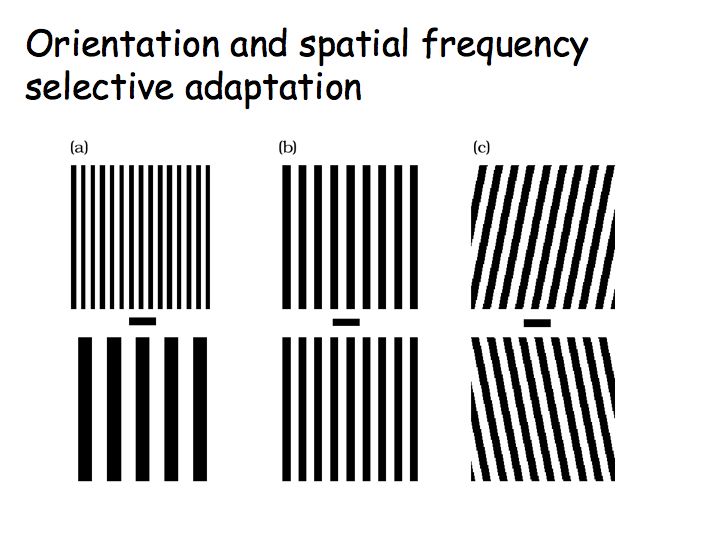
The orientation selectivity of visual processing and representation in V1 is evident also in perception. Look first at panel (b) in the below figure and you will see two vertical gratings. Next fixate on the horizontal bar in the middle of panel (c) and hold your eyes on that fixation for 30 seconds or so. Then look back at panel (b), fixating again on the horizontal bar in the middle of the panel. What do you see? Why? Finally, adapt for 30 sec or so on panel (a) and then look back at panel (b). What do you see and why?
Hubel and Wiesel also discovered that the neurons in V1 are arranged in an orderly fashion. Neurons with similar response properties (e.g., the same orientation preference) lie nearby one another.
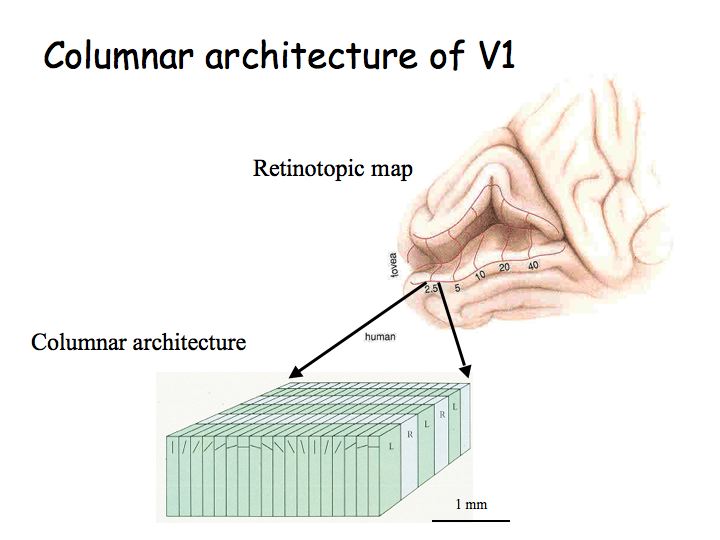
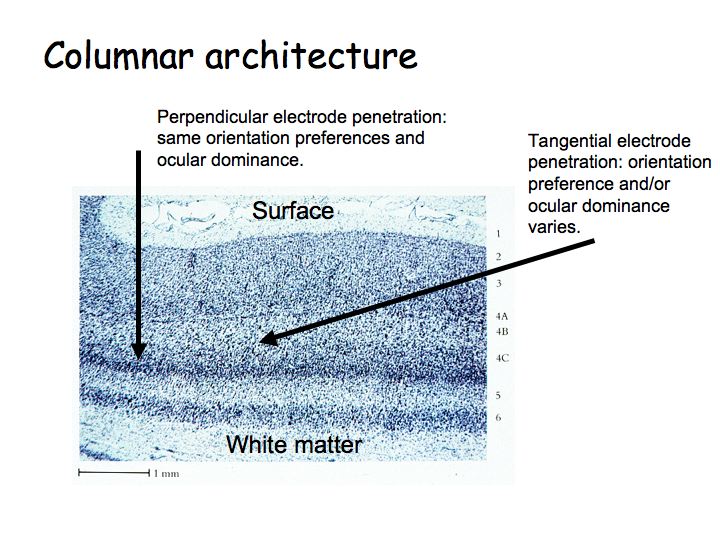
Columnar architecture: As one moves an electrode vertically through the thickness of cortex, one finds that most neurons have the same selectivity (e.g., the same orientation preference and eye dominance). Ocular dominance columns: As one moves an electrode tangentially through the cortex, one first finds cells that respond to left eye inputs, then binocular (responsive to both/either eye), then right eye, then binocular, then left again, etc. Orientation columns: As one moves the electrode tangentially in the orthogonal direction, one first find cells selective for vertical, then diagonal, then horizontal, etc. A hypercolumn is a chunk of cortex about 1 mm square by 3 mm thickn that contains neurons, all with approximately the same receptive field location, but with all different orientation selectivities, direction selectivities, both (left- and right-) eye dominances represented.
The notion of a functional columnar architecture is a big theme in cortical physiology. We'll see other visual brain centers with analogous organization: area MT has a columnar architecture of direction selectivity for visual motion perception, area IT has a columnar architecture of complex shape/feature selectivity for object recognition.
The functional architecture of V1 has been studied extensively. Hubel and Wiesel's initial results have been replicated in recent years using optical imaging methods. In optical imaging, you open a hole in the skull, point video camera at the brain, and collect images that reflect the relative amount of oxygenated ("red") versus deoxygenated ("blue") blood.
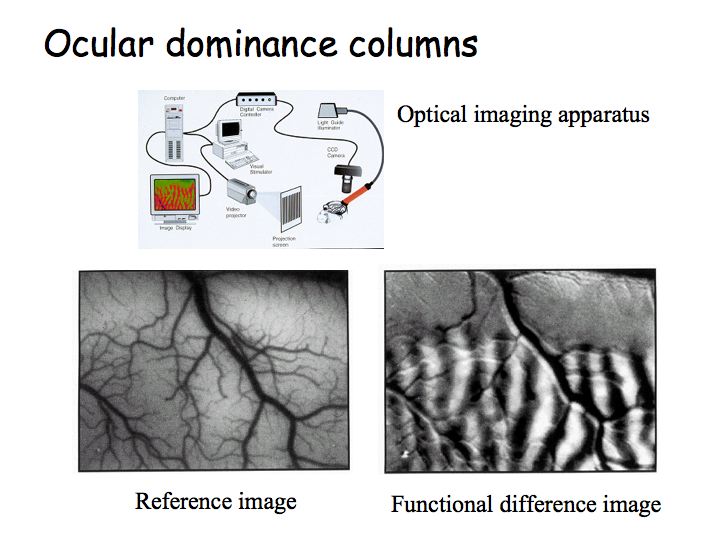
Top: diagram of optical imaging experiment and apparatus. Left image: picture of the brain while the animal views stimuli with the left eye (right eye patched/occluded). Then, one takes a picture of the brain while the animal views stimuli with the right eye. Right image: subtract one image from the other to get a picture that looks like zebra stripes - these are the ocular dominance columns.
Ocular dominance movie (12 Mb QuickTime movie)
In class we viewed a video that demonstrates the optical imaging procedure for visualizing ocular dominance columns. You can download this movie (clicking above).
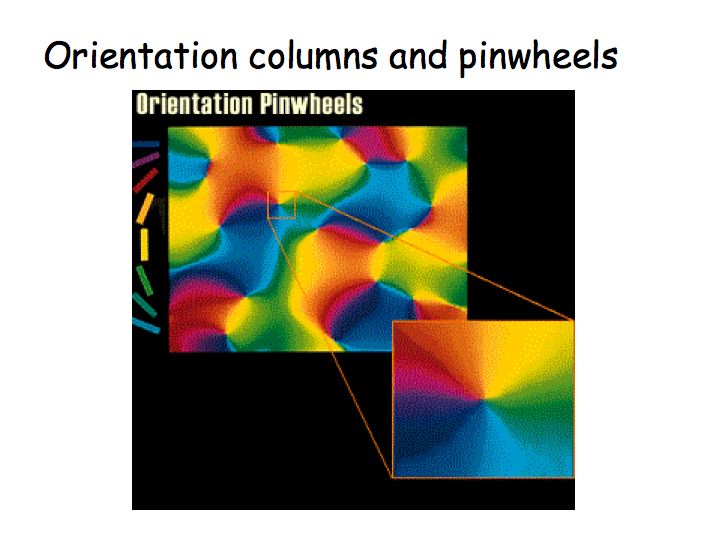
Analogous experiment have been carried out, but using orientation (e.g., vertical versus horizontal) instead of eye input (right eye vs left eye). This gives a picture of the orientation columns in the monkey brain.
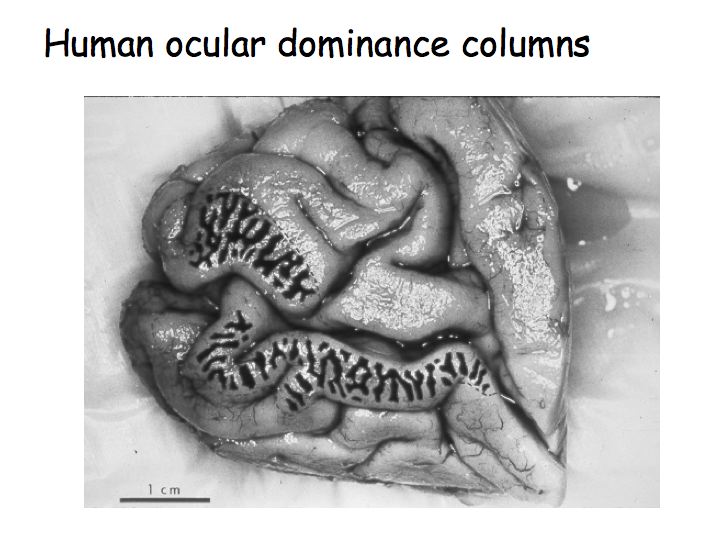
Ocular dominance columns are also present in human V1. This is a picture of a post-mortem human brain (medial view of the occipital lobe and the Calcarine sulcus). This patient had lost an eye before they died so only the neurons responding to the other eye were active. The patient had given permission for their brain to be removed and analyzed immediately after they had died. The brain was stained for cytochrome oxidase (an enzyme used in cellular metabolism) so the dark stripes correspond to brain regions that had been recently metabolically active. In other words, the dark and light stripes are this patient's ocular dominance columns.
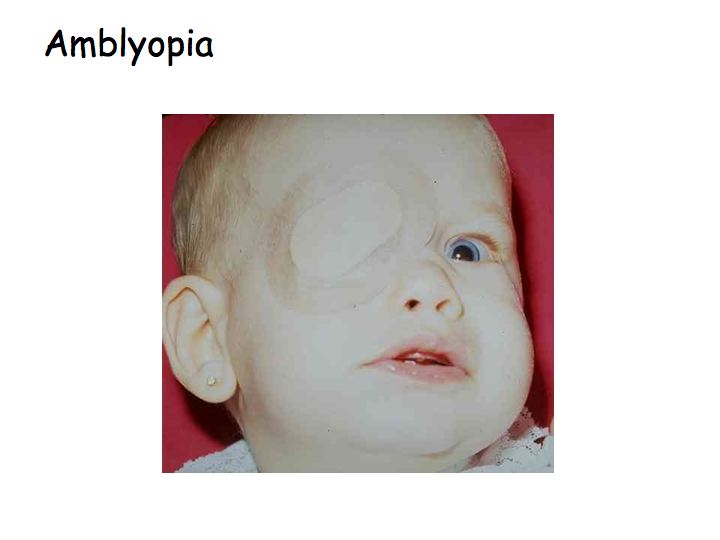
Amblyopia, or cortical blindness, is a term that refers to a variety of visual disorders when there is no problem with the eye (the optics and retina are fine), but one eye has better vision than the other. Amblyopia can be caused by strabismus (wandering eye) if it is not corrected in infancy. What appears to happen is that during development, if the signals from one eye are weak or out of register with input from the other eye, then the brain develops in a way that ignores the signals from the weak or misdirected eye.
Hubel and Wiesel performed a classic experiment on this topic. They raised kittens with one eye sutured shut (monocular deprivation) and found that the ocular dominance columns did not develop properly. Instead, primary visual cortex organized itself to respond almost entirely to the undeprived eye. They found that there is a critical period during development up until the kittens are about 4 months old. Monocular deprivation during this period messes up the ocular dominance columns. Deprivation after the critical period has no effect. If the kittens were monocularly deprived throughout the critical period, then they could never regain the proper ocular dominance organization.
Consequently, we now know that we must intervene in infancy to prevent amblyopia. A wandering eye can often be corrected surgically, but not until a baby is old enough. In the meantime, one covers an infant's good eye with a patch for a few hours each day so that the brain must rely on signals from the bad eye. This helps the brain develop properly to process signals coming from both eyes.